
The three phases of the creative process are idea generation, organization, and assessment. Brainstorming is the primary tool for generating ideas. Affinity diagrams are used to do a high-level organization of the ideas and the fishbone diagram is used to drill down and do root cause analysis. This is typically done in the Analyze phase of the Six Sigma DMAIC process.
Overview: What Is a Fishbone Diagram?
Fishbone diagrams, also known as Cause and Effect Diagrams, Ishikawa diagrams, and the 6 Ms, were popularized in the 1960s by Kaoru Ishikawa, who pioneered quality management processes in the Kawasaki shipyards. The basic concept was first used in the 1920s and is considered one of the seven basic quality control tools.
The graphic below shows the format for a fishbone diagram:
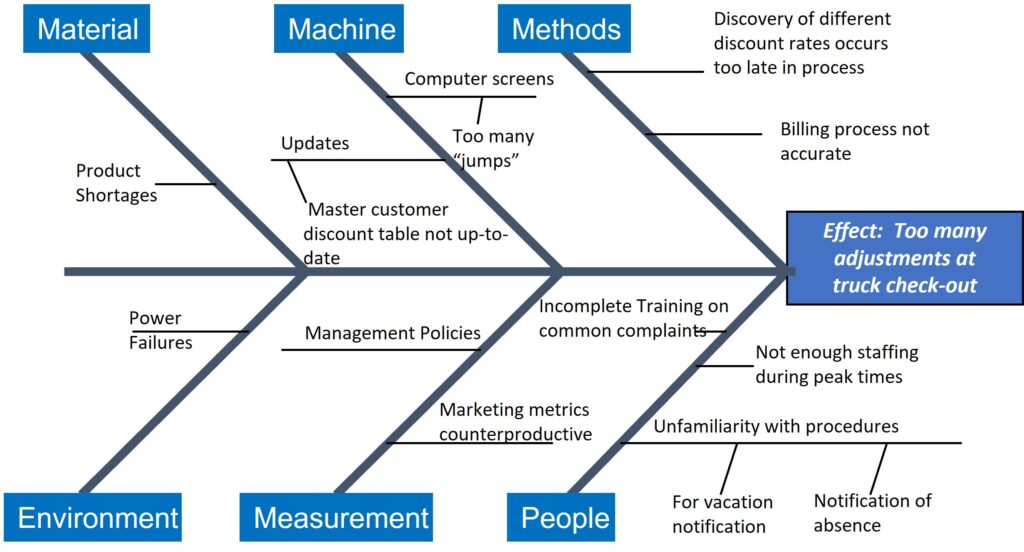
The head of the fish represents the problem being addressed. The main bones are the major categories of possible root causes. The smaller bones represent the cascading and drilling down of possible root causes.
The process for creating a fishbone diagram is as follows:
- Name the problem or effect of interest.
- Decide the major categories for causes. This can come from the themes in your affinity diagram.
- Typically, your fishbone diagram will have 4-6 main bones representing the major causes of what you are analyzing.
- Major causes may include the 6 M’s: manpower (or personnel), machines, materials, methods, measurements, and mother nature (or environment).
- Brainstorm for more detailed causes. Ask why each major cause happens at least 5 times.
- Eliminate causes that do not apply.
- Discuss the causes and decide which are most important. If you have existing data or can collect data on the potential causes, then you can make objective rather than subjective decisions about the validity of that potential root cause.
- Work on the most important root causes.
- Perform another iteration to determine root causes if necessary.
An Industry Example of a Fishbone Diagram
A software company was concerned about losing business to its competitors. They put an improvement team together to try and understand what the causes of their reduced competitiveness might be. The Six Sigma Master Black Belt assigned to the team held a brainstorming session to try and identify potential root causes.
After gathering all the ideas, the team developed an Affinity Diagram and identified several themes or possible root cause categories. Since this was not a manufacturing problem, they selected more appropriate transactional categories. The graphic below shows the outcome of their root causes analysis and application of a fishbone diagram.
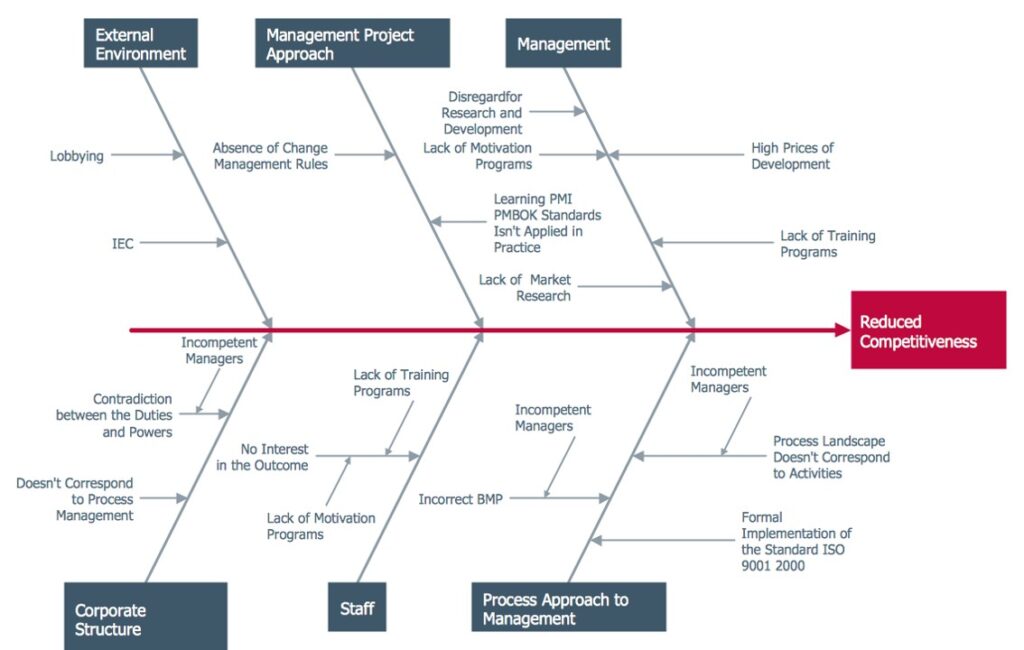
Other Useful Tools and Concepts
While we’ve spent a fair amount of time discussing the fishbone diagram, it isn’t the only thing you’re going to use. As such, one of the most effective things you can do is to learn the 5Ws. It helps to question things as they go wrong, but this proven method will get you to the bottom of an issue with ease.
Additionally, you can look at how both the Ishikawa diagram and the 5Ws intersect. We’ve got a wonderful resource covering the details of how they work together that you can read here.
Conclusion
Problem-solving is hard enough, but having the tools to get to the bottom of an issue is paramount. As such, I hope you consider implementing the Ishikawa diagram into your root cause analysis today. It is an effective and proven tool, and one that has seen use across several industries.