Tag: trend

TaaG Analysis – Fast and Easy for Comparing Trends in Large Data Sets
Published:TaaG (trends at a glance) analysis is a fast way to compare trends of subsets of data across large data sets. It is an ideal tool to use in the Measure and Control phases of DMAIC (Define, Measure, Analyze, Improve, Control) projects. The value of TaaG analysis is best understood by way of example. Suppose […]
Read more »
Top Lean Six Sigma IT Trends to Come in 2011
Published:As the calendar flips to 2011, several technology experts and software providers have made predictions about how Lean Six Sigma and other process improvement methodologies will shape IT departments in the coming year. Collected here are four of their forecasts for the next 12 months.
Read more »
Making Sense of Time Series Forecasting
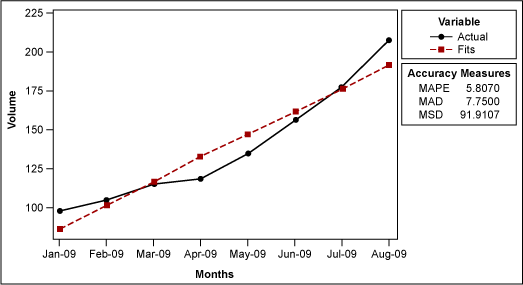
Published:It is a common scenario: A practitioner has sales data for the past several months and wants to forecast next month’s sales volume. This type of forecasting can help manufacturers and distributors ensure they have enough product to meet customer demands. But how is this forecasting done? Statistical analysis software offers two ways to plot […]
Read more »