
A couple of days ago, during a particularly boring meeting I started to doodle. But it wasn’t one of those doodles where you draw a box, then put a cross in it, then shade it, add a couple of surrounding circles, give it legs etc…. it was a doodle with purpose, I started doodling Lean Six Sigma!
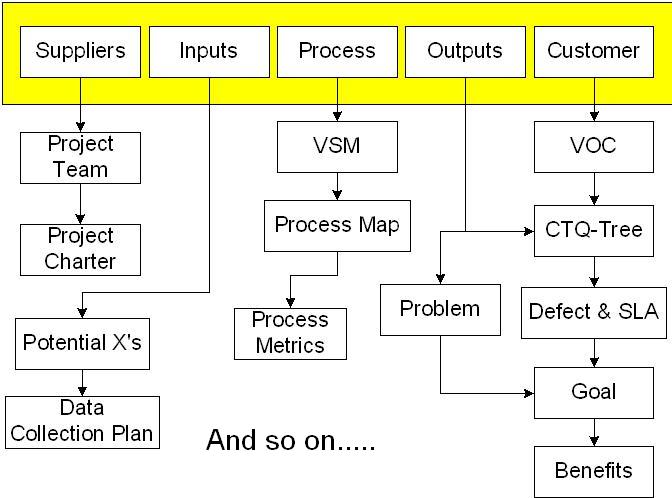
It started with a SIPOC. I think the SIPOC has huge value and is somewhat a misunderstood tool. I started drawing the relationships between the SIPOC and other tools used in Define. Things just started appearing around it. I have had a go at distilling some of the areas with the “mind map” below. I have journeyed from Define to Improve on paper so far.
I hunted around the Internet to see where this has been done before so I can see what the finished article would look like. But in terms of models, most describe Lean Six Sigma from 30,000 ft or describe things like which tool to use and when, the outputs at each DMAIC stage, the roles and responsibilities required, the maturity of the deployment and the best structure and critical success factors. All these are extremely useful, but not quite what I was after.
What I imagined was an A3 size poster with all the tools shown with the inter-relationships, a picture that would “jigsaw” all the tools together. Not sure if one exists, so am pursuing my own endeavours.