Too often manufacturing operations are quick to look at a technological solution or other capital investment to solve a problem, when leaders already have all they need right in front of them. An investment in human capital can make quick gains for less money.
Sticky Business
Consider the following example. In the Midwest a manufacturing company with more than 1,500 employees worked a round-the-clock 24/7 schedule. The company manufactures a product that is sticky; it requires a high-velocity, high-volume production through one of 14 different cutting and packing machines.
Four teams worked rotating 12-hour shifts on those 14 different machines. Employee morale was consistently a problem due to the long shifts – in particular, some employees ended up working most weekends. At the time, the throughput efficiency was about 65 percent.
The finance department calculated that if the throughput efficiency of the product increased to 70 percent, enough could be manufactured in 16 hours of production to meet customer demand. Then the company could move to a system of two eight-hour shifts – giving more free time to the workers and saving the company money.
In this high-velocity (more than 2,000 pieces a minute) environment, the product needs to enter the first machine in correct alignment in order to move through a series of rotating metallic parts, where it then meets – and is wrapped by – paper.
Over time, the product gets out of alignment due to its high speed of motion. Due to its sticky nature, the product can also get stuck on the metallic parts of the machinery; this slows down or stops the process as a whole. At that point, an operator must stop the machinery, open up a gear box and clear out the jam by removing paper and cleaning off residual sticky product, or by troubleshooting via a number of other methods.
This slow down or stoppage happened about five to 10 times every hour per machine.
The operators are experienced and highly adept at finding and correcting the problems of the jammed machinery. They bring the process back up as quickly as possible (and their speed increases over time), which improves the overall efficiency and throughput of the line.
Variables of Efficiency
The plant engineers knew that efficiency varied with product type – some brands are stickier than others. The stickier the product, the more clogs in the gears of the machinery can be expected. Certain machines perform better than other machines. And some operators are better than others. But which of those variables was most important? And by how much?
Answering these questions was critical – each 1 percent movement on efficiency would save approximately $250,000 according to the finance department.
Data captured by program logic controllers on each of the machines included how many pieces of product they wrapped and at what times. The company had data on the following variables:
- The machines
- The operators’ hours (operators sign in via a bar code on their badges when they begin their shifts)
- Pieces of product produced
- Time to produce product
- Reason (out of a few given choices) machinery went down
- Where (physically) the fault lay within the machinery
The company needed to solve the original problem of which variable was the biggest driver of efficiency loss among the following:
- Machine
- Product type
- Operator
- Hour of day
Reviewing the Data
Machine difference was clear from the data collected over a six-month period as shown in Table 1.
| Table 1: Average Throughput Percentages Per Machine | |
| Machine | Average Throughput (%) |
| G | 80.17 |
| R | 79.47 |
| A | 75.10 |
| Q | 73.87 |
| E | 64.92 |
| C | 63.77 |
| B | 62.87 |
| D | 62.41 |
| P | 61.09 |
| F | 59.26 |
| O | 58.11 |
| S | 57.86 |
| H | 56.41 |
| Note: One machine was down during this period so data was collected for only 13 machines. | |
One machine was tracking well at 80.17 percent throughput while another was tracking poorly at only 56.41 percent throughput.
The variance in throughput by the top 20 percent (by volume) of product flavors was recorded and is shown in Table 2.
| Table 2: Average Throughput Percentages by Flavor | |
| Flavor | Average Throughput (%) |
| c | 87.58 |
| b | 86.57 |
| a | 76.75 |
| d | 76.37 |
| e | 73.69 |
| h | 65.82 |
| g | 59.88 |
| i | 58.54 |
| f | 54.63 |
| j | 50.98 |
Flavor c ran well in the machines to the point of an 87.58 percent throughput, while flavor j struggled with only 50.98 percent throughput.
The operator tied to each machine was also looked at; Table 3 shows the top 5 percent and bottom 5 percent of performers.
| Table 3: Average Throughput Percentages by Operator | |
| Operator | Average Throughput (%) |
| Alfred | 82.48 |
| Betty | 81.56 |
| Charlie | 78.78 |
| David | 77.49 |
| Pat | 64.42 |
| Quinten | 62.94 |
| Randy | 61.27 |
| Steve | 56.56 |
The best operator performed at an 82.48 percent throughput while the worst was at 56.56 percent.
The three variables show a wide range in performance. The real question was: Are the machine efficiency numbers driven by who the operator is and/or what flavor is being run?
Regression Analysis
It was known that the more machines an operator worked on, the worse that operator’s overall performance was.
Table 4 shows the results of a binary logistic regression. Based on the number of lines worked, Table 4 displays the probability of a given operator making the goal of 70 percent throughput in the past six months of work.
| Table 4: Probability of Operator Meeting 70 Percent Throughput Goal | |
| Number of Lines Worked | Probability of Meeting Goal (%) |
| 1 | 79.99 |
| 2 | 66.62 |
| 3 | 48.50 |
| 4 | 30.77 |
| 5 | 17.34 |
| 6 | 9.01 |
| 7 | 4.46 |
| 8 | 2.16 |
| 9 | 1.03 |
The probability of operators meeting the production goal of 70 percent throughput dipped below 50 percent if they worked on three or more lines. It seemed that the company needed operators to master one to two machines rather than working on several.
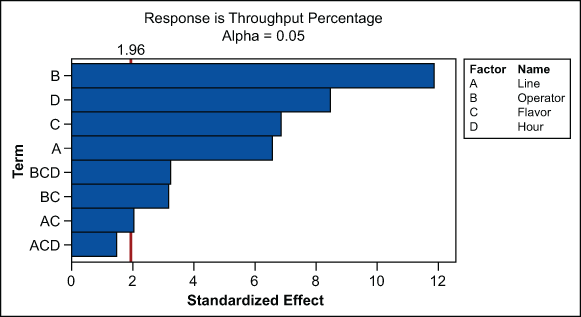
The next step was to determine which of the four variables (machine, flavor, operator and hour of day) had the most significant influence on percentage throughput. The results of a general linear model ANOVA (analysis of variance) are shown in Figure 1.

This analysis showed that all of the variables are statistically significant, including all of the interactions except the following:
- AC – line and flavor: The machine the flavor ran on was not significant. A particular flavor ran the same regardless of what machine it was run on.
- ACD – line, flavor and hour: The hour of the day did not matter in how a particular flavor ran. A given flavor ran the same regardless of what machine or what hour of the day it ran.
| Table 5: Estimated Effects and Coefficients for Throughput (%) | |||||
| Term | Effect | Coeff | SE Coff | T | P |
| Constant | 60.927 | 1.0199 | 59.74 | 0.0000 | |
| Machine | 9.140 | 4.570 | 0.6951 | 6.57 | 0.0000 |
| Operator | 15.303 | 7.652 | 0.6466 | 11.83 | 0.0000 |
| Flavor | 7.045 | 3.523 | 0.5133 | 6.86 | 0.0000 |
| Hour | 16.803 | 8.402 | 0.9949 | 8.44 | 0.0000 |
| Line*flavor | 6.192 | 3.096 | 1.5202 | 2.04 | 0.052 |
| Operator*flavor | -9.617 | -4.809 | 1.5010 | -3.20 | 0.001 |
| Line*flavor*hour | -4.389 | -2.195 | 1.4884 | -1.47 | 0.140 |
| Operator*flavor*hour | 9.641 | 4.820 | 1.4883 | 3.24 | 0.002 |
The ANOVA revealed the variables with the bigger impacts, but further analysis was needed to show the magnitudes of these differences (see Table 5).
The results show that hour and operator are the most significant variables at two times the impact of flavor or machine.
The significant variables ordered by impact are shown in Table 6.
| Table 6: Significant Variables by Magnitude of Coefficient | |
| Factor(s) | Coefficient |
| Hour | 8.40 |
| Operator | 7.65 |
| Operator*flavor*hour | 4.82 |
| Operator*flavor | 4.80 |
| Line | 4.57 |
| Flavor | 3.52 |
| Line*flavor | 3.1 |
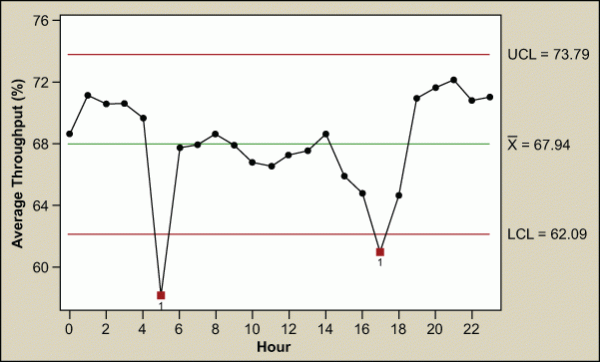
The hour at which the work is performed has the biggest impact. This was due to the drop off in throughput percentage at 5 a.m. and 5 p.m. – when shift changes occurred.

During the turnover at shift changes, a large drop-off in throughput occurred. Operators were the next largest driver.
Operators mattered more than flavor and machine when it came to how efficiently the plant ran; operator interaction with flavor had a bigger impact than the line and or the flavor acting alone. This showed that in order to improve the throughput, attention needed to focus on the operators – as is the case in a lot of manufacturing problems.
Although the assumption was that the problem would lie with the machinery or other technology, this issue was one of human resources at its core.
Letting the Operators Do Their Best Work
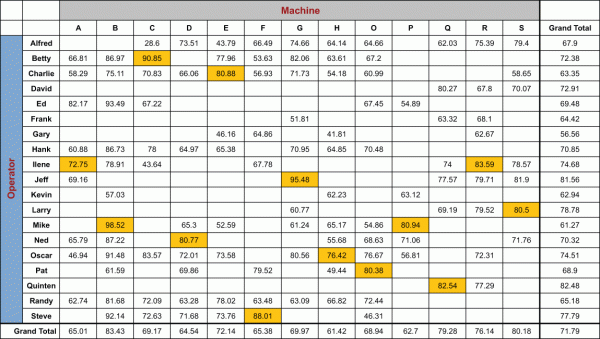
It was known which operators run best on which machines. As the plant operated, however, workers came in for their shifts and went to whichever machine they wanted – or to whichever happened to be open – and began their shifts. But what if at the start of each shift the operators went to the machines they performed the best on? Would that correspond to an immediate uptick in efficiency?
Figure 3 shows the data for each operator on each machine and how each operator performed over the past six months for one particular shift of operators.

Using this data, the company could assign a good operator for each machine. (Surprisingly, sometimes the same operators perform just as well on two machines as one.)
The Results
Just putting the operators on their best machines raised the throughput percentage average to 71.79 percent, just above the goal of 70 percent. This allowed the operators to change to eight-hour shifts.
As a 1-percent efficiency increase saved $250,000, the average throughput for the prior 12 months of 65 percent equated to approximately $1.7 million annualized. Just putting the right people in the right spots saved millions of dollars. In addition, employees were happier with the new work schedule.
After a six-week experiment, the throughput had increased to more than 73 percent and the plant made the shift changes permanent.