
Stop guessing what your customers value in your product or service. Use conjoint analysis to determine what features are most important to them and have the data to support your decisions.
Conjoint analysis is often described as a design of experiments (DOE) for marketing. It is a structured way to help you identify and evaluate the features of your product or service from your customers’ perspective. It is more efficient and effective than mere guessing or using other market research tools.
For one company, it became an advantage for identifying the optimal design and features of a beverage product quickly so it could beat the competition to the consuming public.
This Company Didn’t Want To Repeat the Errors of the Past
The company’s marketing department wanted to introduce a new beverage drink in a striking new packaging format to have eye appeal on the grocery shelf. The chief financial officer became aware of the project but, based on previous product failures, was a little concerned the marketing team for this product would repeat the errors of the past. He reached out to the senior Master Black Belt (MBB) of the company and requested he attend the marketing team meetings and provide technical input into the design process.
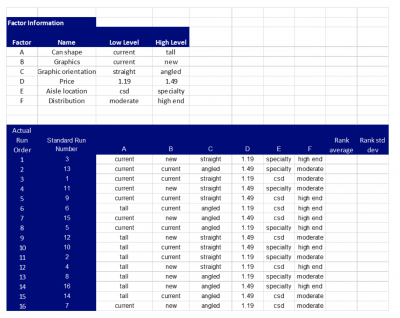
At the first meeting, the MBB, Ben, just listened and took notes. The discussion was around the different product and design features. One feature was the shape of the can the product was to be sold in. The options were the common 12 oz. container or a taller, slimmer can, similar to Red Bull. Another feature was the graphics and their orientation. The graphics could be updated to appear more contemporary or remain similar to the company’s other products. The graphic orientation could be horizontal, as on other cans, or at an angle. Two price points were discussed: $1.49 and $1.19. The location of the product on the shelves was discussed next. Should it be in the soft drink aisle or a specialty aisle? Finally, who is the target customer and desired distribution channel? Was it upscale chains such as Whole Foods and Fresh Market, or more moderate chains such as Food Lion and Walmart?
From the discussion, it became apparent to Ben that the marketing team was going to make the decisions and then do market research on their final selections. Since there were two choices for each of the six features, there were 64 unique combinations (2^6). Ben wondered how they were going to select the best one.
Ben decided to ask the team if they had ever heard of conjoint analysis since they were all marketing professionals. The marketing director said she had and that they had frequently used it in the past. Ben asked if she would be kind enough to send him some examples of their use of it in the past. After the meeting, the CFO called and asked for feedback on the meeting.
The next day, Ben received the promised examples. After conferring with Carlos, another MBB on staff, they both determined the marketing director had never done a complete conjoint analysis. After providing the requested feedback to the CFO, Ben was advised to push the team on using a formalized conjoint analysis, and he was going to inform the chief marketing officer (CMO) of his instructions to Ben. Being cautious, Ben asked Carlos to accompany him to the next meeting so there would be a witness and another set of ears for the discussion.
Ben Pushed Hard To Use Conjoint Analysis (and Advised Them on How To Do It)
Since the team hadn’t done a conjoint analysis before, Ben and Carlos prepared a presentation and examples of how to do a conjoint analysis. While the statistical analysis is similar to multiple linear regression and requires statistical software to do, the actual data collection is less complicated.
Ben and Carlos recommended the following procedure for using conjoint analysis to gather customer feedback on the six features.
- Have the team evaluate the 64 combinations and eliminate those that are not viable or practical. After considerable analysis and discussion, the 64 were reduced to 16. This was a more manageable number of options.
- A DOE orthogonal or balanced array of the 16 unique combinations was created.
- Sixteen poster boards (22”x28”) were made representing the six factor combinations.
- Twenty-five subjects were randomly selected from an existing pool of participants used by the company for other market research projects.
- Each subject was asked to look at one poster board at a time and then rank each based on their overall preference, with the first poster board being their most preferred and the 16th being their least preferred option. The values for these rankings were given a value of 1-16. The order of the boards was shown randomly to the test subjects.
- The average and standard deviation of the rankings were computed and entered into the statistical software.
- The regression analysis was run, and the top two combinations were selected for field testing.
Below is the data sheet before the subjects were shown the poster boards and data entered.
It Was Tough Convincing the Marketing Team To Use Conjoint Analysis
Ben ran into a real challenge when trying to convince the marketing team to use conjoint analysis instead of their preferred “shoot from the hip” approach. Despite all of Ben’s efforts, the team wanted to decide on the best combination and then field test it.
After providing that feedback to the CFO, he intervened and strongly advised his counterpart to try what Ben was recommending. This seemed to do the trick, and the team reluctantly agreed to try conjoint analysis. Ben was engaged in helping set up the experiment and lead the analytical component at the end.
The poster boards were created, subjects recruited, and the experiment was run following the methodology shown above in the Excel worksheet. Everything went smoothly, and the data was captured as planned. It became evident to the team that the process was not as difficult as they initially thought – and that it might yield better results for future projects.
Here are some of the advantages and disadvantages of conjoint analysis.
Advantages of Conjoint Analysis:
- The analysis can be carried out on physical as well as conceptual variables.
- Preferences by different subjects can be consolidated to arrive at a composite evaluation.
Disadvantages of Conjoint Analysis:
- If too many attributes of a product are included in the study, the number of combinations can become too large for people to discriminate between.
- Gathering information from the respondents can be challenging.
- If unique and unusual combinations are included, subjects may have difficulty understanding what they mean.
- Subjective responses may not accurately reflect what people will do in real life.
The Experiment Yielded Excellent Results, and the Product Was Successful
After analyzing the outcome of the experiment, two of the combinations ranked far and above the other 14. Ben had a hard time keeping a straight face when presenting the results to the team since the combination the team intuitively thought was the best ranked 9th out of the 16. Working with manufacturing, sales, and distribution, the team had the test product produced for testing in the field.
While five of the features were easy to do, a decision needed to be made as to the location of the stores to place the product samples in. The location needed to be chosen to adequately represent any differences that might exist between the shoppers of moderate and high-end stores. The metric of success was measured in terms of sales dollars and an onsite live interview by a member of the marketing team to capture the decision process of the buyer.
After running the market testing for three weeks, the results were in. The best results were for:
- A tall can
- With updated angled graphics
- Since pricing was not significant, the company should use the higher price
- With placement in the specialty aisle at higher-end stores
This was different than the original intuitive suggestion by the team of using:
- A tall can
- With current graphics and orientation
- Priced at $1.19
- Placed in the CSD (carbonated soda drink) aisle in a moderate chain
It is not uncommon for organizations to face the issue of data versus intuition, as was the case for this company.
Dilbert seems to capture this conflict in the cartoon below:

3 Best Practices When Trying To Use Conjoint Analysis
While the company was reluctant to use conjoint analysis at the beginning, they eventually saw the value and have embraced it for future projects where applicable. Here are a few tips should your company decide to use conjoint analysis.
Limit the Number of Factors and Combinations
If your customers have to choose and rank too many options, it will be difficult for them to distinguish between them. The general rule of thumb is to try and keep the number of attributes to seven or less, otherwise, the combinations may be too many. You can also screen out some of the poor or infeasible combinations.
Try To Use Visual Rather Than Text Combinations
Reading and responding may present more challenges for understanding the option being offered than using visual or aural options.
Pilot Before Full Execution
Use a sample to pilot the design before fully executing your experiment. This way, you can spot any deficiencies in your design before expending too much time and money on something faulty.
Conclusion
Using intuition or a seat of the pants approach to understand your customers’ perceptions of your product or service can result in less-than-optimal outcomes. Conjoint analysis provides a data-based method for evaluating or designing your product or service. When done properly, this technique can provide you insights into your customers’ perceptions more quickly and at a lower cost than other market research techniques.