
Process Cycle Efficiency (PCE) is a simple calculation that will define what percent of your total processing time is consumed by waste. It will also show you where that waste is and how you might try to reduce or eliminate it. This article will present the calculations used for PCE and how you can use it to improve your process and create greater customer satisfaction.
What Is Process Cycle Efficiency?

Waste exists in almost every process. We typically define this waste in eight categories referred to as the 8 Wastes of Lean. To fully understand what PCE is, you need to understand the concepts and calculation of Process Lead Time, Little’s Law, and Customer Value Added activity.
Process Lead Time (PLT) is the time it takes from when an item enters a process to the time it exits the process. The formula for PLT is simply:
PLT=WIP/ER
In other words, the Process Lead Time, PLT is equal to the WIP, or work in process (average number of items in the queue or line) divided by the ER, or exit rate (average number of items that exit the process per a specified unit of time).
Unfortunately, the work being done on the item will be made up of customer value-added (CVA) tasks as well as non-value-added (NVA) tasks. We can define a CVA task as one that:
- Changes the fit, form, or function of the item
- The customer feels it is important and is willing to pay you for it
- Is done right the first time with no rework
A non-value-added task is one that:
- If the customer knew you were doing this, would they request that you eliminate the activity so you could lower your prices?
- Is not a customer value-added activity
- You should try to eliminate or reduce
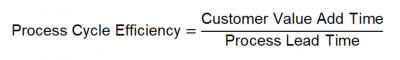
The question that PCE answers is, “What proportion or percent of the PLT is attributable to CVA?” The remainder will be the waste that is in your process. The formula for PCE is:
Putting It In Action
Let’s show an example to illustrate the calculations you would do to calculate PCE for this process.
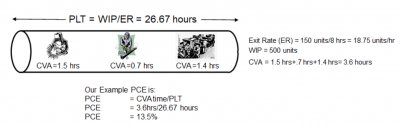
In this example, this process PCE is equal to 13.5%. This means of the total time that a unit is in the process, only 13.5% of that time is spent on things that the customer feels is important and is willing to pay for. The rest of the time is spent doing things that are not important to the customer, and they are not willing to pay for it.
To give you an idea as to what PCE benchmarks might be considered good or not good, let’s look at a chart that was put together by the George Group based on calculations derived from 100 of their clients.
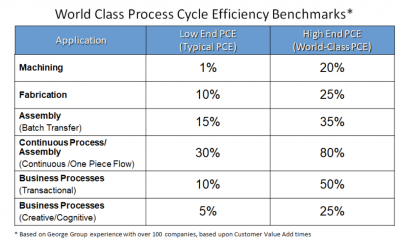
Since the process in our example would be classified as a fabrication application, the 13.5% PCE would put this process toward the low end of Process Cycle Efficiency.
Benefits of Process Cycle Efficiency
It’s important to have a baseline understanding of how your process is performing before you can even attempt any efforts to try and improve it.
Simple Calculations
The calculations for PCE are simple and easy to do. It’s just one number divided by another.
Quantifiable Value for Waste
If the percent PCE is the proportion of CVA in the process, then (1-PCE) is a measure of waste and non-value added.
You Can Back Into the Required PLT
If you get the desired value of your PCE from the George Group table and the CVA of the process, you can use algebra to back into the value of PLT needed to give you the desired PCE. You can also back into the desired WIP or ER using some algebraic manipulation.
Why Is Process Cycle Efficiency Important to Understand?

The more you understand your process and can quantify its performance, the more you will understand what needs to be done to deliver the product or service faster to your customer.
Understanding PCE Lets You Understand Your Process PLT, WIP, ER, NVA, and CVA
The relationship between these variables allows for mathematical gymnastics to understand most of your process performance metrics.
Appreciation of the Existence of Waste
Knowing how much waste exists in your process will help lead you to the various sources so they can be eliminated or mitigated.
Improve Customer Satisfaction
Most customers want their product or service done as quickly as possible. By increasing the PCE, your PLT may go down, and you will be able to deliver your product or service quicker to your customer.
An Industry Example
The finance department of a CPG company was having difficulty meeting the CFO’s expectations for reporting monthly results after the books were closed at month’s end. A team was tasked with reducing the PLT for producing the required reports after the books were closed from 10 days to 3 days.
The team did a Value Stream Map to determine where waste and non-value-added tasks were being performed. From there, they calculated the current value-added tasks. Then they calculated the current state PCE, which was around 5%.
Using the George Group table of benchmark PCEs and the value-added activities, they concluded that they either needed to reduce the in-process WIP or improve the exit rate of the process to achieve the desired PLT of 3 days. By eliminating much of the non-value-added activities the team was able to improve the PCE and achieve the desired PLT.
Best Practices for PCE
There are a few things to keep in mind when using PCE to improve your process.
Data, Data, Data
Be sure you have data on the PLT and CVA so you aren’t guessing. Without credible data, you may be led down a rabbit hole and draw conclusions that are misleading or incorrect.
Use a Stretch Value for Your Intended PCE
Use the George Group table and strive for the World Class metrics. While it may take a while to achieve your goal, continue improving your PLT and thus your PCE.
If Reducing WIP Is Your Goal, Go Slowly
If reducing WIP is an important strategy for you to improve PLT, slowly drain the process WIP rather than doing it instantaneously. When you reduce WIP too quickly, you may starve your process, create out-of-stock, and inadvertently increase PLT, thereby reducing your PCE.
Other Useful Tools and Concepts
Speaking of waste, have you designed your work instructions to accommodate standard work? Standard work is paramount across a variety of industries and helps clue in your employees to the standards and expectations of your deliverables while onboarding new workers.
Additionally, if you’re looking at defects and waste, then DPU is worth learning about. This calculation allows you see to the proportion of defects making it out to customers with relative ease.
Conclusion
PCE is a simple measure of the amount of time an item in a process is being subjected to customer value-added work that is important to the customer and that they are willing to pay for. It is expressed as a percentage of the customer value-added time divided by the total process lead time.
By mathematically solving for the different variables in the formulas for PCE and PLT, you can analyze and improve PCE by solving for WIP, exit rate, and PLT.
Depending on which variable you have data on and your desired outcomes, these simple algebraic rearrangements can eventually lead you to improve your process so you can save money by eliminating waste and improve customer satisfaction by reducing PLT and more quickly delivering what the customer wants.