
Six Sigma scatter diagrams and their correlation analyses often debunk management myths. Many times executives assume and/or presume that measures vary together when they do not. Sometimes they assume and/or presume that measures do not vary in concert with one another when they do. For better or worse, budget forecasts are based on these assumptions. Knowing which factors do and don’t vary together improves forecasting accuracy. Improved forecasts can reduce decision risk.
Being able to quantify the degree of co-variation, called correlation, helps leaders understand whether assumptions are on or off base. The word correlation does not imply or mean, causation. A correlation simply means that two measures tend to vary together. A perfect positive, one-to-one (1:1) correlation has a correlation coefficient of +1. A perfect 1:1 negative correlation has a correlation of -1. Since everything varies, one rarely sees a perfect correlation. If you see a perfect correlation coefficient doubt it.
The following table arrays an older Six Sigma executive’s age and the price of gasoline over the past 50 years. Because the paired recorded data is in sequential order, we can analyze the data. Notice each field is homogeneous; data fields are not mixed together as they would be in a traditional spreadsheet.
| Table 1: Age and Gasoline Price Table | ||
| Year | My Age | Gasoline Price |
| 1950 | 0 | $0.06 |
| 1955 | 5 | $0.12 |
| 1960 | 10 | $0.27 |
| 1965 | 15 | $0.15 |
| 1970 | 20 | $0.52 |
| 1975 | 25 | $0.64 |
| 1980 | 30 | $0.76 |
| 1985 | 35 | $0.89 |
| 1990 | 40 | $1.10 |
| 1995 | 45 | $1.19 |
| 2000 | 50 | $1.40 |
With the data contained in the two columns labeled My Age and Gasoline Price, one can easily create a Scatter diagram using most of the statistical software programs available today. With a bit of advanced training you can add titles for eye appeal.
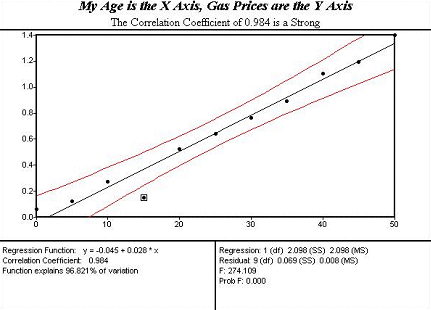
The linear relationship between the correlation’s coordinate points on the X axis, my age, and the price of gasoline on the Y axis is almost perfect, 0.984. The correlation number, 0.984 is called an r value in Six Sigma jargon. By using the straight black line to coordinate age values on the X axis and price values on the Y axis, what was the price when this executive was 22? What was the price when he was 48? Looking into the future, a process called extrapolation, what would you predict the price of gasoline and the executive’s age will be in 2005?
Did an executive’s age cause the price of gasoline to increase? No. But, the two measures do tend to vary together. As one gets larger, so does the other. This is a linear relationship, meaning the black line in the middle of the chart describes the relationship. It is an easy chart to interpret. The red ‘curved lines’ framing the line are called confidence intervals.
As a rule of thumb a strong correlation or relationship has an r-value range of between 0.85 to 1, or -0.85 to -1. In a moderate correlation, the r-value ranges from 0.75 to 0.85 or, -0.75 to -0.85. In a weak correlation, one that is not a very helpful predictor, r ranges from 0.60 to 0.74 or -0.60 to 0.74. Though an entirely random relationship equals, 0.00, any relationship that has a correlation r-value that is 0.59 and below is not considered to be a reliable predictor.
The scatter diagram below illustrates a case in point. In this enterprise, finance managers assumed that there was a linear relationship, a correlation, between monthly operating expenses and the number of units their factory processed. The shotgun pattern illustrates that the simple linear relationship is so weak, that their predictions were invariably misleading.
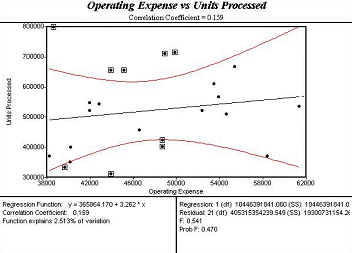
The low r value of 0.159 suggests that there was virtually no relationship between these two factors. This insight helped the team focus on other key factors that did matter. The insight gained from Six Sigma statistics saved time and money.