Key Points
- VMBs are a great way of visualizing progress and sharing information.
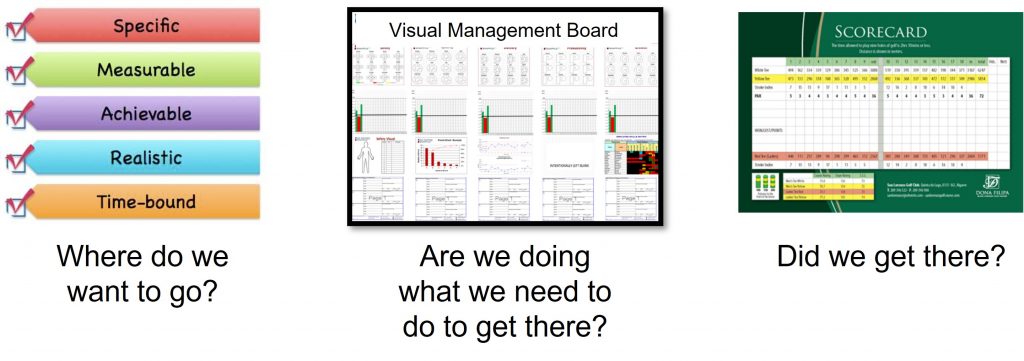
- You have to establish the criteria and goals of the board before creating it.
- You can leverage VMBs to achieve your KPIs with ease.
Visual Management Boards played a critical role in enabling this company to link and visually display critical metrics, KPIs, and actions simply and consistently.
So, what are Visual Management Boards? Today, we’re exploring how these visualization tools can let your company reach new heights. While the company is fictional, the results speak for themselves. Without further ado, let’s dive right into it.
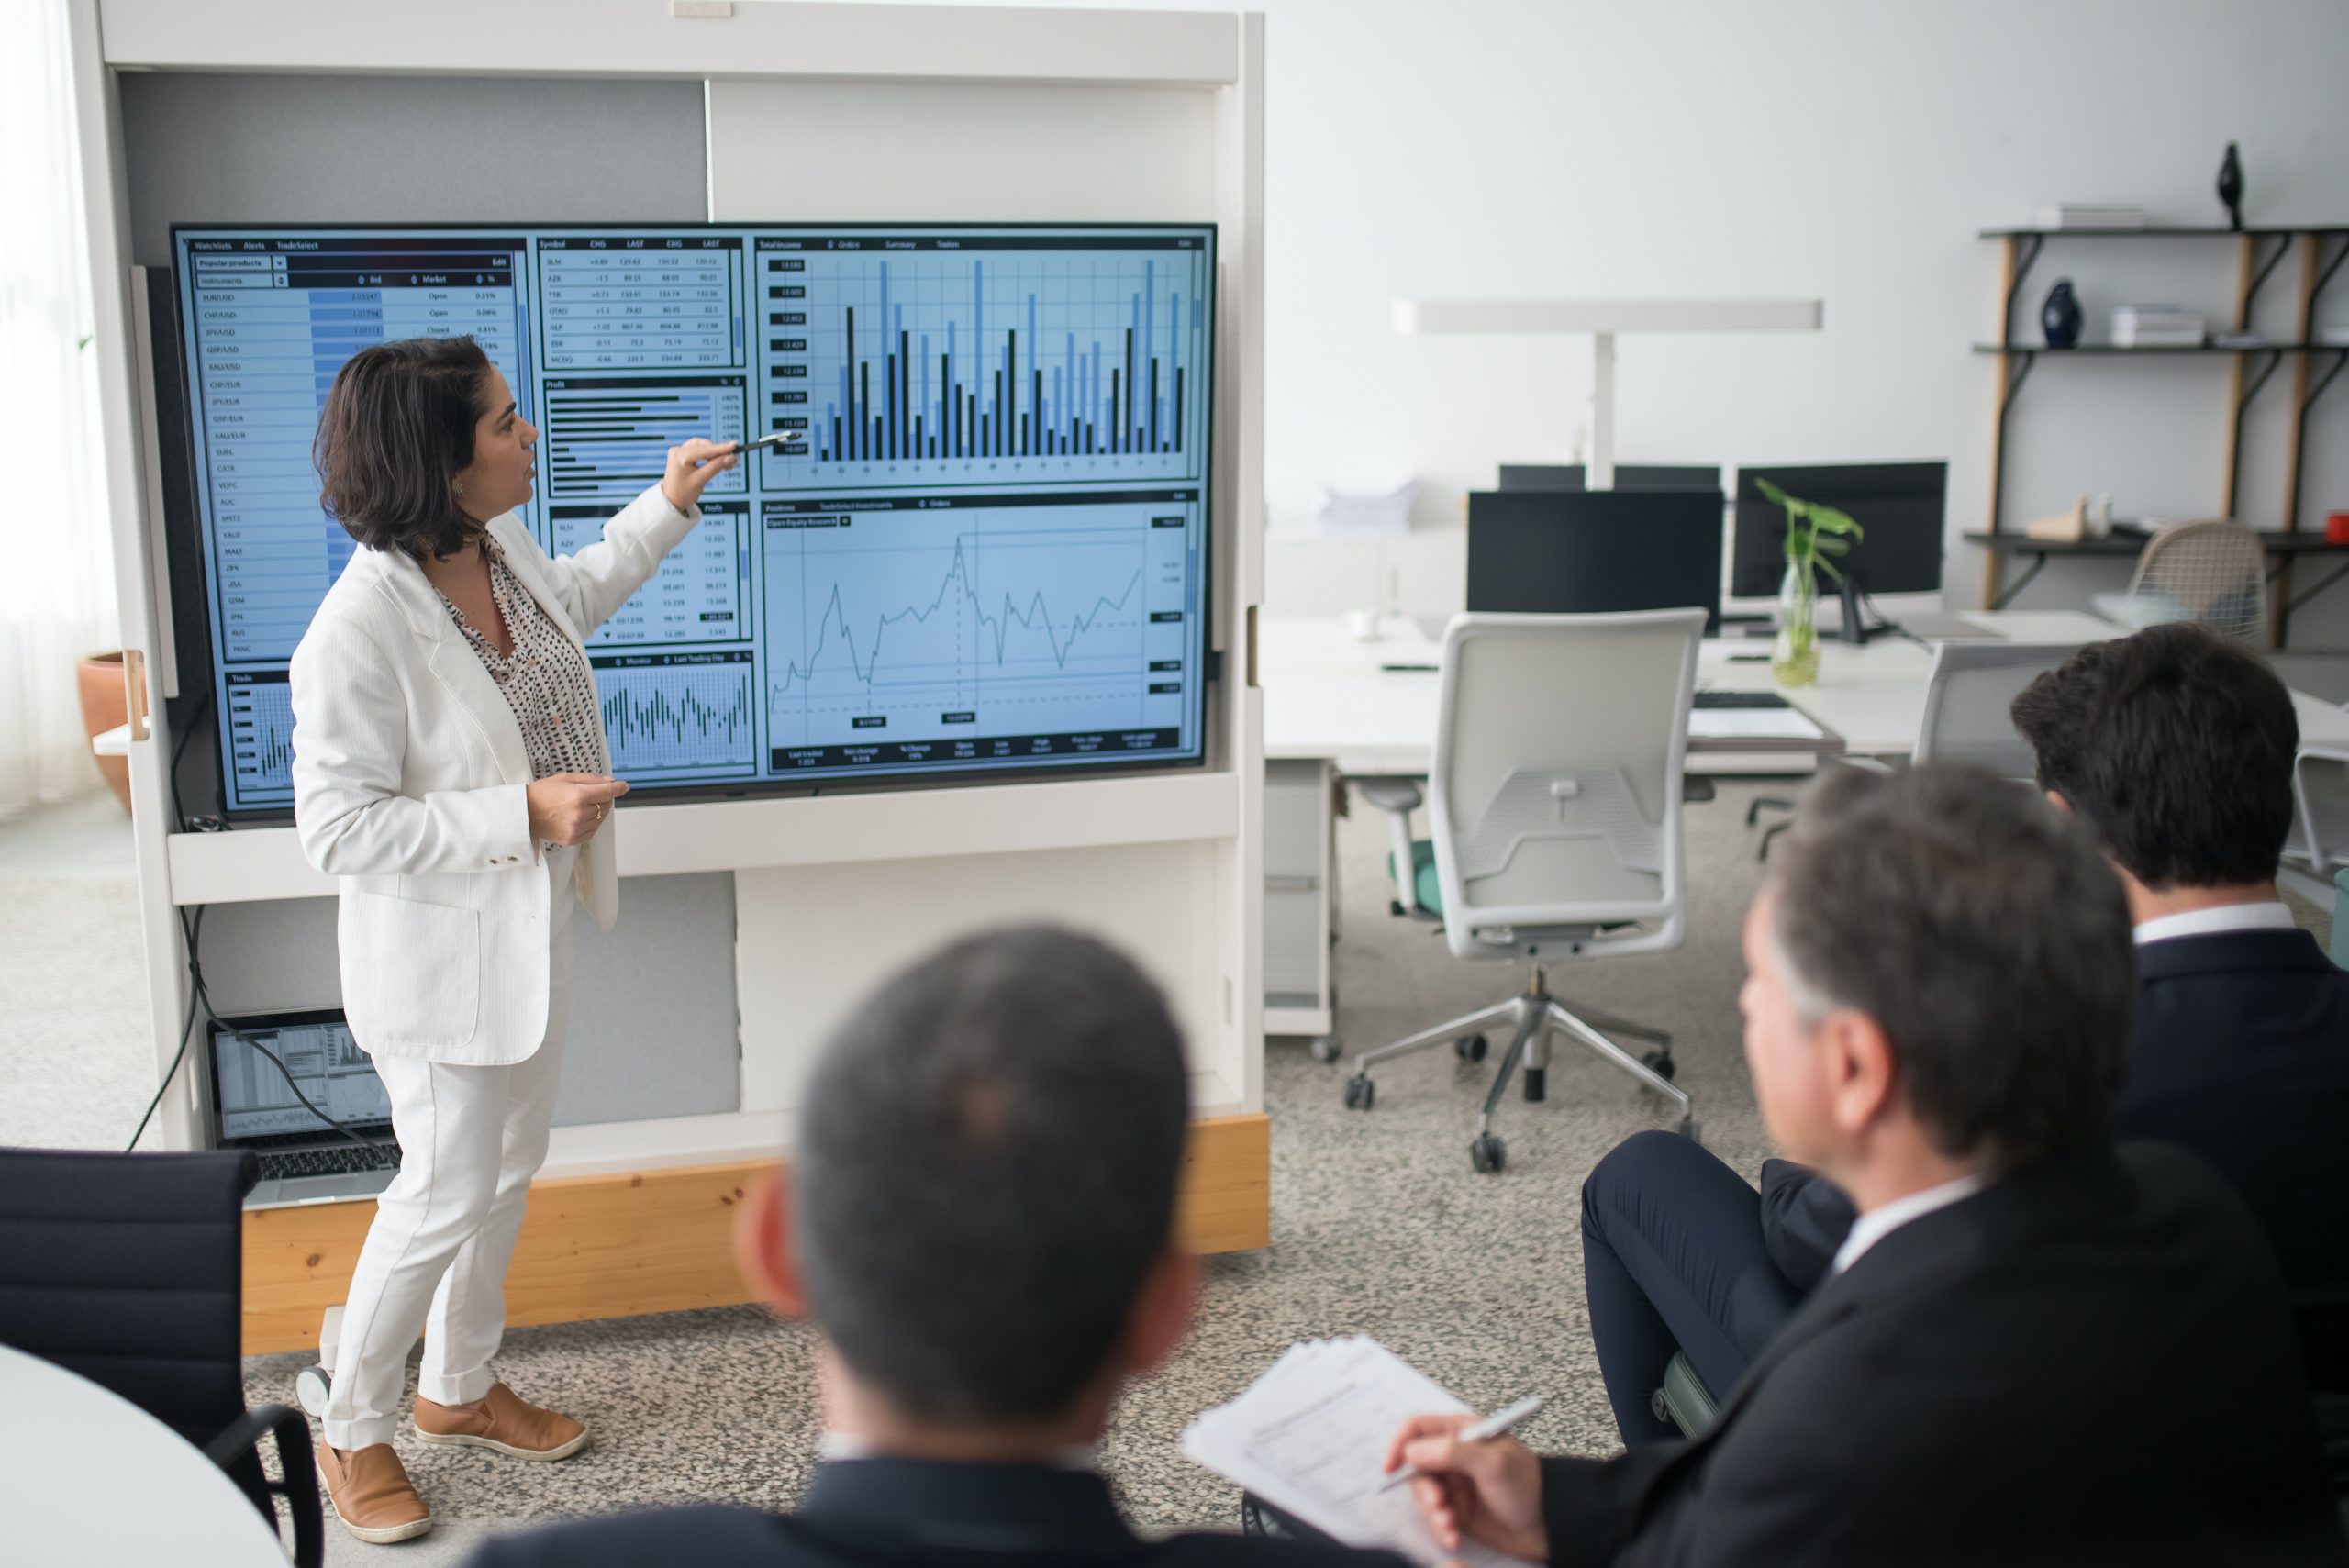
Using Visual Management Boards (VMBs), the Company Was Able to Consistently Create and Display Critical Organizational Information
A Visual Management Board (VMB) is used to display critical information in a clear, simple, and visual manner. Before the widespread use of VMBs, each functional area maintained its own format for collecting and sharing critical information. There was no commonality of what the critical categories of information were, nor the format of how to display them.
Before Making VMBS, Agree on the Categories
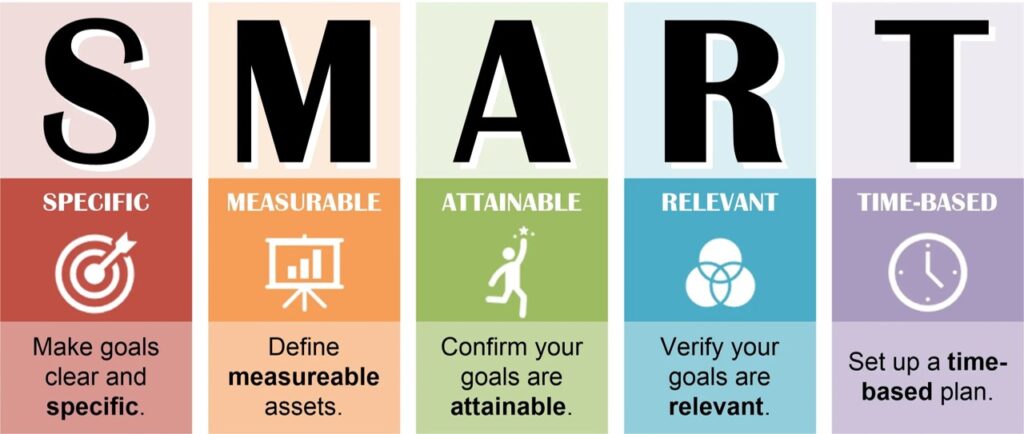
The company had been using SMART goals and scorecards as the way they collected and displayed information.
Goals Are Good, Especially SMART Ones
What Do They Tell You?
- What do you want to achieve and by when?
What Do You Do About It?
- You might create tactics to get there.
- You keep your focus on achieving them.
Scorecards Are Good Because They:
- They tell you how you did
- They tell you what you should be focused on
They Also Tell You What You Should Do
- You will try to do better next time
- You may do some course correcting before the next scorecard, but often it’s too late
- You hope your score is good….or someone else’s is worse
VMBs Fall Between SMART Goals and Scorecards
The Company Chose to Use the Following Five Planks to Display on VMBs
Safety, Quality, Delivery, Productivity, and Growth
All of their actions were focused on driving toward improvement in these five planks. Safety was put at the top because everything they do must be done safely. Focusing on safety, quality, delivery, productivity, and growth, in that order, ensured a balanced approach to the way they used the tools of continuous improvement (CI).
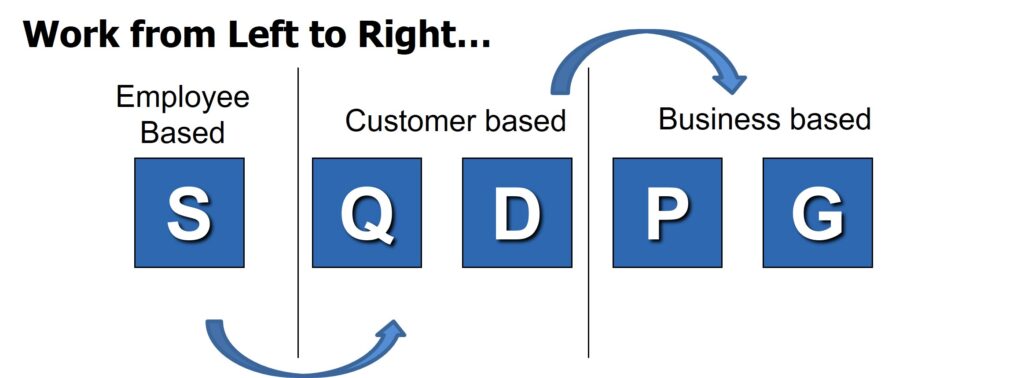
SQDPG Define
- Safety – most importantly – must have a safe work environment for employees
- Quality – after safety, providing a quality product to the customer is the primary objective
- Delivery – think of this as a customer-focused metric – are you delivering to your customers’ satisfaction per the voice of the customer (VOC)
- Productivity – think of this as a company-focused metric – are you delivering to your stakeholders’ satisfaction per voice of business (VOB)
- Growth – this metric focuses on the growth of the employees or the growth of your business, whichever is most applicable in the functional area
What They Considered When Designing the VMB
- Should be directed toward a group, not individuals
- Visuals should communicate a PLAN & ACTION
- Involve all employees in the visual management process
- Do not use visual management to punish
- Drive to solve problems in a blameless environment
- Should be standardized
Once the Base Was Established, the Format for Building the VMB Metrics Was Next
How to Determine Metrics
- Start with individual cascaded objectives when building metrics
- Consider department or function Strategic metrics, if applicable
- Consider any operational metrics coming out of CI activity to support the control plans
- Metrics should be relevant to the workgroup. The team should be able to impact the results. If they can’t, look for another metric
- Metrics need to be measurable frequently – daily or weekly is best
- Metrics should be leading indicators, or predictive, as often as possible. Lagging indicators typically do not allow time to impact the outcome
How to Set Targets
- Metrics should, ideally, show 50% red (below target) and 50% green (at or above target) for each metric
- If your metrics are consistently green, the target may not be aggressive enough.
- RED IS NOT NECESSARILY BAD! Red helps you to continuously improve through root cause analysis and implementing improvement plans.
- Targets may or may not reflect company goals initially. Preliminary targets for the team may be initially set and then gradually move to meeting and exceeding company-set goals and stretch goals.
With the Metrics Established, It Was Time to Create the VMB
- Identify the key metrics to be displayed on the Visual Management Board (VMB)
- Should be operational
- Develop a clear operational definition of the metric
- May come from individual job metrics
- May cascade down from the senior leader’s strategic goals
- Should represent, as appropriate, and reflect the platforms of SQDPG (Safety, Quality, Delivery, Productivity and Growth)
- Should be approved by the manager
- Determine the source of where data will be collected for each metric
This Was the Final Design of the VMB
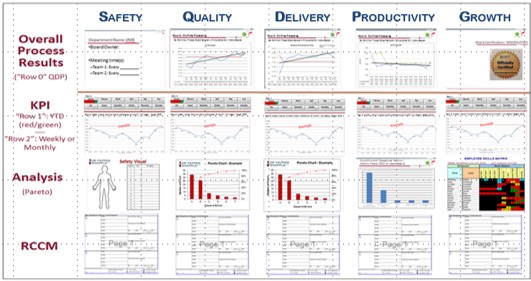
Defining the Rows Came Next
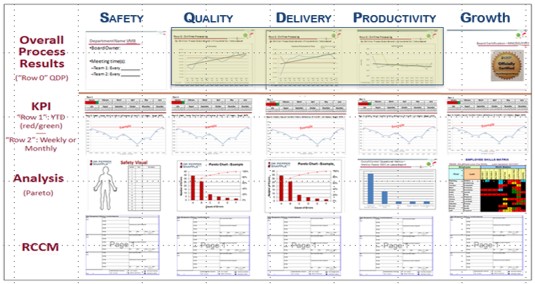
Row 0
- Row 0 targets for Quality and Delivery should be developed based on VOC
- Productivity targets are based on key internal metrics
- Row 0 should reflect a rolling 12-24 month view with a trend line
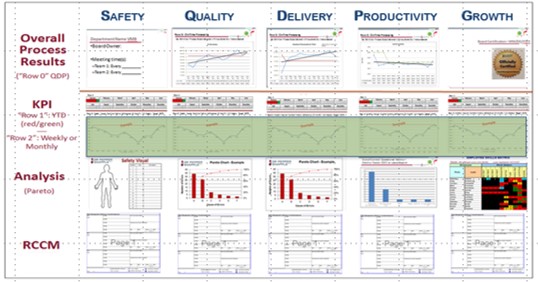
First Row
- This view is for monitoring the process metric against your target in the short run
- Preferably these should be tracked on a daily or weekly basis
- It is a simple red/green (didn’t meet or met target)
- Try not to select metrics that can only be monitored monthly
Second Row
- Customer-facing metrics, Quality, and Delivery, can be tied directly to VOC
- Productivity is a measure of input/output (required) and can be tied to a Value Stream Map
- Daily/Weekly Row clearly states what is being measured and the goal is quantified (a number)
- Trending can be seen clearly on the daily/weekly chart
- Metrics are tracked on a daily or weekly basis (optimal). Monthly metrics may be acceptable for transactional/back-office boards, but effort should be made to develop more frequent data captures
- To focus on reducing waste in your processes, you must listen to the voice of the customer.
- Time or money/output is the best way to measure productivity
- Call out exactly what is being measured, so it is easily understood
- Trending allows us to see how performance is tracking over time
- The more frequently you capture data points, the more you can effect change
Third Row
- The Analytics Row clearly shows reasons for defects of goal misses and is not a print-out of data or multiple charts
- Bridges the gap between scorecard and root cause analysis
- Capture data as real-time as possible
- Allows to see trends over time
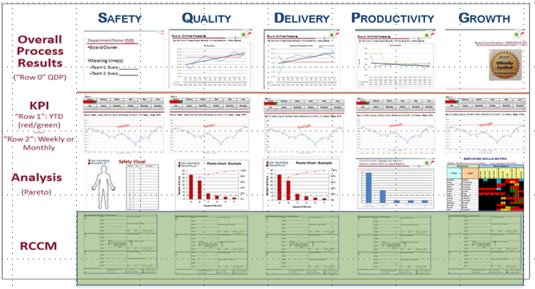
Fourth Row
- Root cause analysis with 5 Whys and root cause countermeasures (RCCM) is being completed consistently when the SQDPG metric is missed two consecutive weeks (reporting periods)
- 5 Why analysis is executed properly
- Action items including people responsible and due dates are assigned as part of the RCCM
- The power of the VMB is in this row
- Find root cause as opposed to course-correcting
- Involve the team (people who do the work) to come up with solutions
- Don’t wait for perfection – Try-storm over Brainstorm
Deploying the VMBs
The first step was to have the CEO communicate that implementing VMBs across the organization was not an option. Through a variety of internal communications, he reiterated the importance of consistent information sharing and that he expected all areas of the organization to develop and display relevant VMBs.
Training classes were held by the company’s Six Sigma Black Belts and Master Black Belts to help the business identify its relevant metrics and how to collect the data. It became the responsibility of each manager to properly deploy VMBs throughout his or her functional areas.
VMBs were deployed starting with corporate functions and then cascading down to every functional area and site. After a year of deployment activity, there were almost 1,000 VMBs all of which looked almost identical except for the specifics of each row. Any executive could visit any site, building, or department and, at a glance, know what is going on and what the area was doing against the SQDPG categories.
Taking Action
Once the VMBs were deployed, each group started to hold VMB standup board meetings. This occurred from the top corporate functions to operators on the shop floor. A VMB board meeting was:
- Used to leverage the Visual Management Board (this can be the physical board or virtual board for decentralized teams)
- Brief – 10-15 minutes is average for Supervisors and direct reports
- Routine and keeps everyone informed
- Focused on short-term actions and plans are developed to close gaps when metric targets are missed consecutively
- Designed to get clarity of issues and can help head off issues that may become a fire drill later
- Interactive – promotes engagement by allowing employees to raise concerns, issues, improvement ideas, or success stories
Why Standup Meetings Matter
- to highlight misses & inaction
- connect the information to action with timely meetings “at the board”
- ensure problems are identified and addressed promptly
- speed up problem-solving
Other Useful Tools and Concepts
Looking for other useful tools to use in your company? Understanding the differences between PDCA and DMAIC can yield vastly different results when going through process improvement. Our exhaustive guide focuses on the differences and when to use each.
Additionally, do you know the differences between accuracy and repeatability? Measurements can be daunting if you’re new to Six Sigma. However, learning the differences between these two can see great results and an increase in quality further down the production line.
Tips for Successful VMB Use
Visual Management Boards Should Be:
- simple
- precisely targeted
- continuously updated
- clean so as not to clutter your mind with irrelevant information
- attractive enough for the entire team to enjoy
- located close to the measurement process
- easily visible to anyone who needs to use it
VMBs Resulted In:
- Lead to information sharing
- Facilitated worker autonomy
- Supported elimination of waste
- Fostered continuous improvement
- Exposed abnormalities
- Enabled quick response & recovery
- Promoted prevention
- Maintained the gains
- Eliminated repeated questions
- Ensured a safe and comfortable working environment
- Increased the company’s profit
- Created a facility that “talks to” people through visuals