
Finding a Framework for Benchmarking and Reverse Engineering
Product development is often forward looking – trying to discover and deliver value for a product or service in our own company. There are times, however, when it is worth learning what the competition has been up to. Some of the same tools that support a company’s internal development can be helpful when applied to competitive analysis.
User stories and measures provide a succinct way to uncover, articulate and track functionality and performance and they can be used for benchmarking and also linked to key aspects of quality function deployment (QFD) analysis.
A Practical, Current Example
The product of interest is one that is getting some reasonable press and buzz lately, the new generation of eReader devices that promise to rival or surpass the printed book experience (at least in some ways) for students, avid readers and business professionals. As these products are an interesting mix of software and mechanical, electrical, and related services design, they form a good basis for this competitive analysis discussion.
User Stories and Measures Balance Simplicity and Detail
User stories are simple phrases that pay attention to the positive and active voice verbs an actor would find valuable in connection with a product or service – the “do” verbs. These verbs describe functionality (what actors can “do”) and the English language contains a broad enough array of verbs to allow descriptions at just the right level of generality or detail. An outline for example with general verbs – read or load at the high level, and more granular verbs such as find, compare, mark and retrieve at lower levels. The actors (users/customers) and the technologists (marketing, engineering) can use necessary verbs to find and articulate a shared understanding about what, exactly, is important to address. No matter how detailed the chosen verb, a company should remain grounded in language that is familiar to the customer, not technical jargon or “engineer-speak.”
Functionality, expressed in the right verbs, leads to questions about performance – how will designers and users know when that functionality is well delivered? Thinking with the customer, about the measures and/or approaches to test and confirm the healthy delivery of each key functionality-verb brings a more valuable understanding of what the company is actually doing and delivering. Together, user stories and measures/tests can uncover and articulate the salient aspects of emerging requirements.
When used in a development mode on individual products and services, the stories and measures are reviewed, refined, and prioritized as a way to bring the right requirements (the higher priority surviving stories and measures) into view.
Taking a Competitive View
Consider the familiar situation of a company (Company U) in a fast-moving business and user environment, where the competition (Competitor Company) is always on the move, introducing new features and working to gain the attention and purchase preferences of Company U’s customers. The Competitor Company has access to a variety of information about what the competition is doing, from their marketing materials, to the plentiful reviews and user discussions available on websites and blogs. Reading through that data in its native, raw form can be overwhelming. User stories and measures provide a framework for uncovering and succinctly articulating functional and performance-focused competitive analysis.
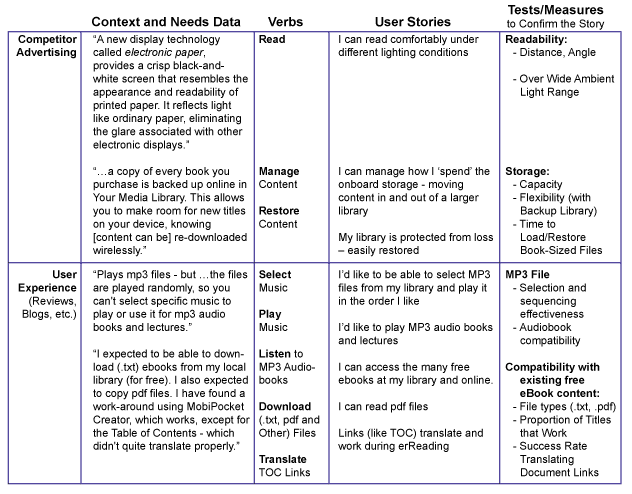
Figure 1illustrates how some of the raw context and needs data available on a competitor’s website (the advertising data) and quotes from user reviews and blogs can be used to mine key verbs, user stories and measures – bringing functional analysis and performance gap analysis into clearer view. While these examples are simple, more complex company-specific descriptions of functionality and performance can be discovered and articulated using this method.
Measures Guide Benchmarking
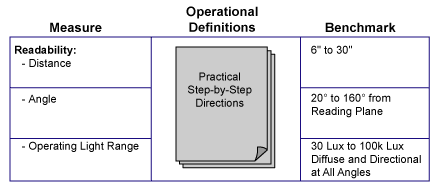
The first step in designing a measure for the critical issues identified during the review is to bring the performance measures into view. As outlined in Figure 2, each measure begs questions about the operational, step-by-step, plan for practically designing a meaningful measure and about the competitor’s current performance benchmark.
Essence of QFD with Competitive Focus
All of the above flow naturally into some of the core elements of QFD. Figure 3 shows a simple excerpt, with user stories in the rows describing the “whats,” as in “What is important to address in the way of requirements?” The columns in QFD may be one or a mix of three things related to prospective solutions and plans in response to the “whats:”
- Measures and their directions of improvement (illustrated by the arrows),
- Prospective features (like wireless and web access), or
- Tasks (not shown here, but may describe things a team or individual would do to contribute to the fulfillment of one or more requirements in the rows).
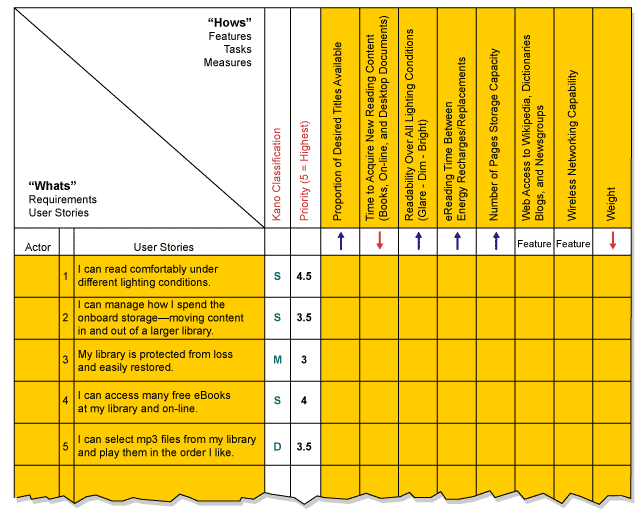
The body of the table in Figure 3 is the relationship matrix part of QFD. The table could reflect the nature of supportive or challenging relationships between each column at each user story intersection, but the matrix is often less interesting and relevant in competitive analysis than a competitive and gap analysis table.
The following competitive and gap analysis provides more interest:
- Competitive analysis on the functionalities (Figure 4, rows)
- Competitive and gap analysis (Figure 5, columns)
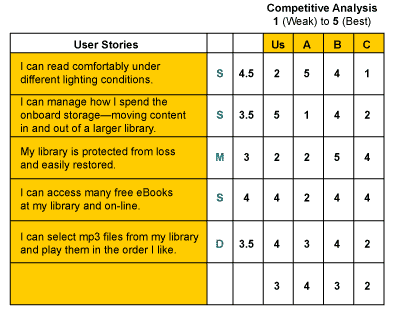
Each number in the competitive analysis section of Figure 4 represents an assessment of how three competitors (A, B, C) do against “our” company (Us) in the functional areas call out in each user story of the QFD rows.
Figure 5 focuses on the columns, posing three different questions to each.
- How difficult would it be to achieve results by driving the measure, feature or task in each column? That achievement gap is assessed in a number (1, easy – 5, very difficult) and summarized visually in a bar graph.
- How difficult is it, or would it be, to measure the described changes? (In this example the most difficult (perceived) measure is “readability” over all lighting conditions.)
- What is the performance level for this column’s measure, feature, or task? This provides another opportunity for competitive benchmarking. (Note the distinction with the row-based competitive analysis. Rows compare customer requirements. Columns focus on internal and fundamental capabilities and constraints that get at the core set of muscles enabling this product or service.)
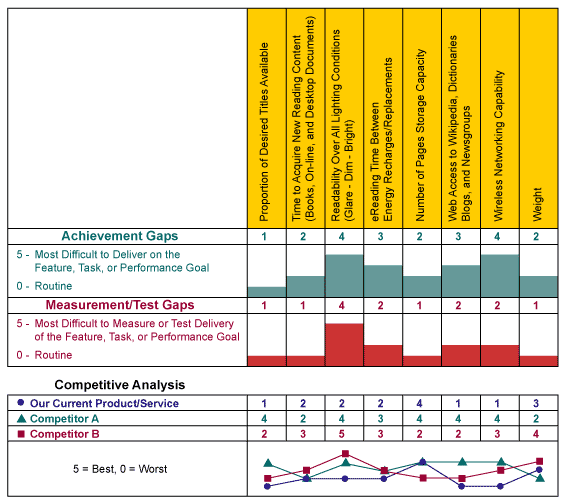
A useful culminating analysis is shown in the line chart at the foot of the QFD in Figure 5. Each measure (and direction of improvement), feature or task is rated. Current levels of performance are compared with (typically) two competitors. The chart shows that the least urgent issue is storage capacity (where “Our Company” scored a 4 and no competitor was better). More urgent are wireless and web capacity columns, where “Our Company” scored lowest in the mix.
Going Further
Try using the spirit of the method described here when using an interesting product or service. Ask the following questions:
- “What am I able to do?”
- “How well can I do it?”
Reach back a step from the user stories and measures and ask:
- “How did the competition learn about this?”
- “What were customers doing in order that this need became identified?”
- “Are there other ways to deliver that functionality and performance or those breakthrough improvements?”
User stories and measures can provide powerful ways to semantically reverse engineer what the competition has done. The user story and measures framework can also provide a crisp, solution-free focus for posing and answering the competitive questions.