
Fear of statistics is often a barrier to learning and applying Six Sigma methods. One way to minimize this fear is to remember that only three things can be done with statistics – describe, compare and relate. Many people are skeptical when they first hear this statement. “It couldn’t be that simple,” they think. However, beginning Six Sigma practitioners may find that this classification system is a helpful way to focus on the goal of the statistical application rather than immediately getting bogged down in statistical equations, symbols and theories. This system not only allows for better cataloguing of current knowledge but also provides a basis for absorbing new material – such as advanced statistical methods – with a clearer understanding.
Why care about reducing the fear-induced barrier to learning statistics? The simple answer is that without statistical thinking there is no data-based decision-making. Six Sigma initiatives give teams permission to improve processes. Most of the decisions made to improve processes are – hopefully – based on data. The language of these data-based decisions is statistics.
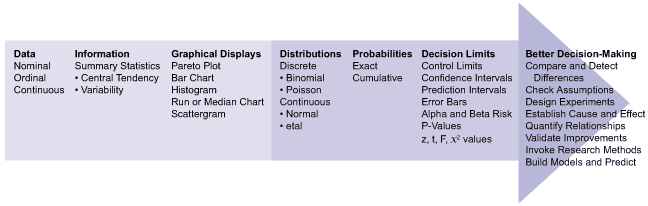
Essentially, data-based decision-making is using statistically based decision limits to make better decisions. It is specifically the fitting of distributions and the establishment of probabilities and decision limits that enable better decision-making.
For example, when a person is presented with a weather map on the morning news with temperature predictions and cold fronts, they decide whether to take an umbrella with them. They are the decision-maker looking at a communication – the weather map, which contains information, temperatures and fronts. That map is based on vast amounts of data and weather prediction models. Every person has some internally determined decision limit or threshold, above which, they decide to grab the umbrella.
Not only do people use statistics to make daily decisions, everyone thinks statistically. People are pattern-based creatures. Everyone calculates probabilities all day long. “What is the probability of snow?” “Should I go home this way or that?” We absorb statistics and probabilities easily but the statistics behind the scenes are a bit tougher. To break through the confusion, take a step back from the equations and symbol logic and remember the three things that can be done with statistics.
1. Describe
Descriptive statistics are concerned with taking data and turning it into useful and consumable information. Transforming data into information starts with summary statistics (mean, median, range, and standard deviation). This is similar to the weather person reporting average temperatures with record lows and highs. Understandably, many folks do not like numerical summaries, tables and spreadsheets. The old saying that “A picture is worth a thousand words” – or numbers in this case – is dead on. Several graphical techniques are available to illustrate and improve communication, including Boxplots, histograms, Paretos, run charts and many others, including a weather map, for example. Another critical part of descriptive statistics is fitting data to distributions (i.e., Poisson, binomial, normal) which is critical for purposes of prediction and decision-making. Think of that 50 percent chance of rain prediction that convinced at least some in the office to carry an umbrella.
2. Compare
The ability to compare things is one of the most useful skills in the Six Sigma body of knowledge. In project work, comparative experiments are used to validate whether a project was successful or not. At least two checks are regularly made to validate projects: First, did the team shift the mean of the main pain project metric? Second, did the team decrease the variability of the main pain project metric? Other uses for comparative experiments are to stratify data, validate relationships and check control groups.
Even though many different types of comparative experiments exist, it is useful to remember that comparative experiments answer only one question, “Did I make a difference?” To answer this question, hypotheses are proposed, assumptions made, samples drawn from one or more populations, test statistics calculated and decisions made. Often a stepwise procedure is employed and it is the same for any comparative experiment: one recipe to answer one question. The only place to mess this up is to pick the wrong test. Therefore, a project team should find a good comparative experiment decision tree to help decide which test to use.
In the weather example, a viewer could explore whether it is more likely to rain in March or April, whether two different TV stations make different predictions, and so forth.
3. Relate
Relating things to one another – in other words, discovering and exploring relationships – helps in understanding and ultimately in establishing predictive models. Relational statistics break up into two broad categories: historical studies and designed experiments. Historical data is analyzed with regression and is comprised of correlations and regression. Correlations ask, “How do two things vary together? Is there a correlation between humidity and rainfall?” Regression asks, “How well can you predict one thing if you know other characteristics?” Designed experiments negate problems with regression with good research methods but require greater planning and execution skills. It may help to think of design of experiments (DOE) as active and regression as passive. DOE explores cause-and-effect relationships between and amongst many variables and also generates prediction models. For example, if a cloud is seeded with compounds X, Y and Z, then how much will it rain? In summary, both DOE and regression are focused on creating predictive models to make better data-based decisions.
Conclusion: A Pyramid to Insight
All three of these statistical wrenches build a foundation upon which advanced statistical analysis and data-based decision-making can be accomplished. It also is worth mentioning that the wrenches are used in a particular order. It takes descriptive statistics to complete comparative statistics and comparative statistics to complete relational statistics. Think of it as a pyramid building toward more advanced and insightful analysis and decision-making. Keeping statistics simple is an ongoing battle. The barrier needs to be kept low to enable more folks to leverage the power of Six Sigma without losing the statistical rigor.