
Control Chart Suggestion
Average And Standard Deviation – X-Bar and s
Control Chart Description
If the sample size is relatively large (e.g., greater than 10-15), the sample standard deviation (s, sigma or s) is a more efficient indicator of process variability. It is typically more difficult to calculate and is less sensitive in detecting special causes of variation that cause only a single value in a subgroup to be unusual. The average and standard deviation control chart is used with continuous/variable data when subgroup or sample size is greater than 10-15.
Control Chart Formulae

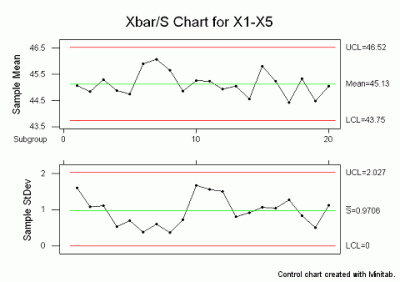
Control Chart Example
Additional Resources
- Average and Standard Deviation (X-Bar and s) Control Charts
- Steps in Constructing an X-Bar and s Control Chart
- Additional Control Chart Links