
The three critical aspects of a running a successful project include project costs, project scope and project schedule. Since projects contain many sources of variation, all three aspects are prone to not meeting targets. Project managers need to use appropriate tools to manage the variability (or risk) in the project.
Critical Path Method
Traditionally, project managers manage schedule risk by using the critical path method. The technique for using this method is to construct a model of the project schedule using a list of all the project activities, the duration of each activity and the dependencies of each activity. The critical path method uses these values to calculate the longest path of planned activities that are required to complete the project. It also calculates the earliest and latest that each activity can start and finish without delaying the project. This method determines which activities are on the “critical path” – the sequence of activities that add up to the longest overall project duration. This determines the shortest time possible to complete the project; any variability on the critical path directly affects the planned project schedule. A project can have several paths that can become critical depending on the actual durations of the project activities.
When you create a model of a project schedule using the critical path method, it is deterministic. This means that you get the same results (in this case, project duration) for a given set of initial conditions (project activity durations). But, in reality, all project activities will display variation due to factors such as poor estimating, unexpected events or undefined customer expectations. This variation creates risk because of its potential to affect the project schedule. Although some project schedules have only a few uncertainties that can be easily managed with good project planning, when the number of uncertainties becomes greater, such as in a large capital project, it becomes more difficult to make the correct decisions.
Probabilistic Method/Monte Carlo
An alternative method for managing the risk in a project schedule is to create a probabilistic model of the project schedule, where activity durations are not described by unique values, but rather by probability distributions. Monte Carlo simulation is a process that generates random values for inputs that are processed through a mathematical model in order to generate multiple scenarios. (The term “Monte Carlo” refers to games of chance, which are popular in Monte Carlo, Monaco.) The distribution type (normal, exponential, uniform, etc.) is specified by the user and is based on the situation that is being modeled. In the case of a project schedule, a probability distribution is developed for each activity on the critical path and the mathematical model is the sum of all the activities on the critical path.
Example of Simulation
Simulation can be performed with many types of computer applications, including Excel. The following simulation was prepared with Crystal Ball software. The basic process is to build a spreadsheet model of the critical path activities, run a simulation of all the activities and then analyze the results. Results are best analyzed using forecast and sensitivity charts.
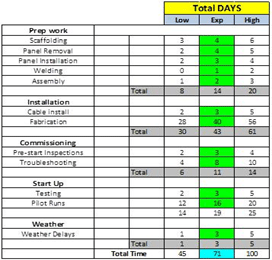
The following figure shows the critical path tasks in an example project. The project team estimated the minimum, expected and maximum durations for each of the project activities. These estimates were used to simulate distributions for each activity on the critical path. The output of this model is the total project duration, which is 71 days. Crystal Ball allows the user to define all the possible values for each activity duration with a distribution.
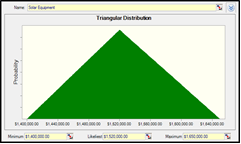
The following figure is an example of a triangular distribution of an activity that was simulated in Crystal Ball. Commonly used distributions to model activity durations include triangular and exponential.
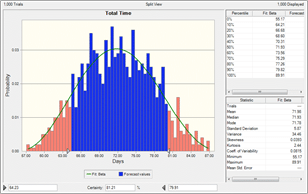
Crystal Ball creates forecast charts to analyze the results of the simulation. These are frequency distributions that display the number of values occurring in a given interval. This chart (Figure 3) is a forecast of total project duration (which was estimated to be 71 days in the deterministic model). A key benefit of this type of analysis is that the certainty level of the project duration can be estimated as being within a specific range (the blue area).
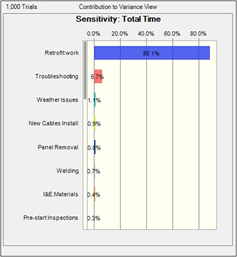
Sensitivity charts can be used to show the influence of each activity on the total project cycle time. The sensitivity chart displays these rankings as a bar chart, indicating which activities are the most important or least important in the model. Sensitivity is calculated by computing correlation coefficients between each activity and the total project duration. A high correlation coefficient means that the activity has a significant impact on the total project duration.
The benefits of this analysis are to: 1) discover which activities most influence the project duration, reducing the amount of time needed to refine estimates, 2) find out which activities least influence the cycle time, so that they can be ignored and 3) develop realistic schedule models that increase the accuracy of your results.
Monte Carlo simulation performs risk analysis by building models of possible results by substituting probability distributions for any factor that has inherent variability. It then calculates multiple results using a different set of random values from the probability distributions. Using this method to analyze the potential risks that could delay the project schedule provides better information than is typically available from using the critical path method by itself. All project managers can benefit from the knowledge gained from a probabilistic analysis of the project schedule. A Monte Carlo simulation using the appropriate software application provides the tools to make the correct decisions and thus reduce risk.