
The effects and impacts of a problem or defect can often be clear to see, but understanding the potential causes can be tricky. Wouldn’t it be great if we had an intuitive, visual tool that helps us to capture potential causes and their relationship to the effect?
Welcome to the cause and effect diagram.
Overview: What is a cause and effect diagram?
A cause and effect diagram is a visual tool used to logically organize the many possible causes for a specific problem or effect by displaying them graphically. The term “cause and effect diagram” is often used interchangeably with fishbone diagram and Ishikawa diagram and is used successfully in continuous improvement activities across many industries and businesses.
The ability to visually represent many potential causes and explore causal relationships is a significant benefit of creating and using a cause and effect diagram. It is particularly helpful if there is little quantitative data available for analysis. However, care should always be taken with the use of qualitative data and hypotheses, ensuring that individual opinion does not bias the outcome.
Logical organization of the possible causes is a key part of creating a cause and effect diagram and these are often categorized with common headings such as Environment, Equipment, Methods, People, Materials, and Measurements.
An example of a cause and effect diagram is shown below:
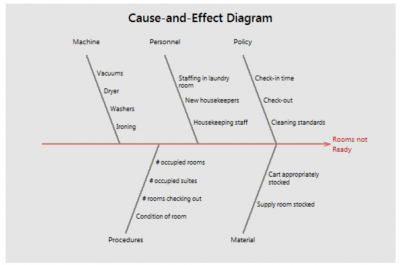
Image source: support.minitab.com
A popular approach for creating a cause and effect diagram is:
- Assemble an enthusiastic team and agree the scope of the task – what effect is to be investigated?
- Conduct brainstorming sessions to capture the many potential causes.
- Graphically represent the causes in a fishbone diagram or similar template.
- Agree what measurements or analysis are required to explore the causes and their quantitative relationships to the effect.
It’s important to remember that the cause and effect diagram alone does not yield the root cause nor sensitivity of effects to the cause.
An industry example of a cause and effect diagram
A healthcare department conducted an internal audit and patient satisfaction survey to better understand department throughput and capacity constraints. The audit and survey both highlighted that long waiting times for the patient when in the department was a key issue both for throughput and patient satisfaction.
The department quality leader, who was experienced in cause and effect determination techniques, decided to explore the causes of long waiting times by using a cause and effect diagram.
A small team from the department were asked to contribute to the cause and effect analysis, taking part in three brainstorming sessions including training on the methods of constructing the diagram.
The primary effect to be explored was agreed as long waiting times and the effects were classified into four main categories: Environment, Equipment, People and Methods. In total, 21 potential causes were identified for review, the cause and effect diagram being displayed clearly in the quality and administration offices for a period of three months whilst potential causes were explored and metrics were defined for acceptable waiting times.
A follow up audit and patient satisfaction survey was conducted after a further six months to provide both quantitative and qualitative data for continuous improvement of patient waiting times.
Frequently Asked Questions (FAQ) about cause and effect diagrams
What is a cause and effect diagram?
A cause and effect diagram is a visual tool used to logically organize the many possible causes for a specific problem or effect by displaying them graphically.
Is a fishbone diagram the same as a cause and effect diagram?
Yes, these names are often used interchangeably, along with Ishikawa diagram.
How do I get started with a cause and effect diagram?
Whilst there are many templates available online, often it’s easier and more productive to get an enthusiastic team together with a flipchart or whiteboard, marker pen, and a bunch of sticky notes.