
How do you convert DPMO to Sigma Level? There are several metrics you can use to measure how well your process is performing. Let’s look at three of them and discuss how to calculate them and how they relate. The three are DPMO, Sigma Level, and Cpk.
Convert DPMO/Sigma to Cpk
Before discussing how you can convert DPMO (defects per million opportunities) to sigma level and then to a value for Cpk, you must understand what each metric means.
DPMO
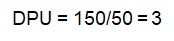
Let’s use an example to illustrate how you would compute DPMO. Assuming you took a sample of 50 documents, totaled the count of all defects found in those 50 documents (assume a total of 150 defects), and then divided that number by your sample size of 50 to get an average estimate of 3 defects per unit or document.
To calculate DPMO, you would use this formula:
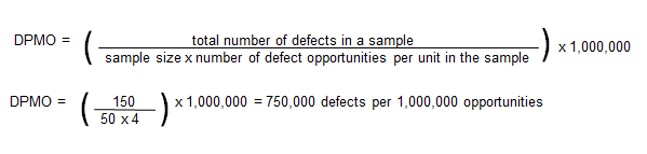
If your organization does not produce a large volume of output, you can also calculate defects per thousand opportunities, or defects per hundred opportunities by multiplying by the appropriate number.
Sigma Level
Sigma level is a statistical calculation that takes short-term information regarding the defects per million opportunities (DPMO) of a process, factors in the tendency of a process sigma to shift over time (1.5 sigma), and gives a Z score including the 1.5 sigma shift.
Cpk
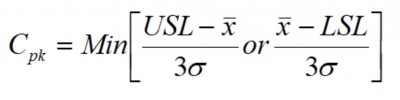
Cpk or capability index, is a measure of process capability and indicates the short-term ability of your process to meet your customer’s specifications, goals, targets, and other numerical expectations. You calculate it as follows where USL/LSL are the upper and lower specification limits and the X-bar is the average of the process:
Overview and Example: How do you convert DPMO/Sigma to Cpk?
A company, that has recently deployed a Lean Six Sigma effort in their organization, asked their Black Belt (BB) to determine the Cpk of a key process using defect data collected by the quality control department.
1,598 total defects were found in their monthly production of 13,500 parts. Each part had only one unique possible defect that could occur. The BB’s first calculation was to compute DPMO. This is the BB’s calculation:
DPMO = (Total number of defects / (sample size x number of defect opportunities)) x 1,000,000
DPMO = (1,598/(13,500 x 1)) x 1,000,000 = 1,598/13,500 x 1,000,000 = 118,370
The next step was to use a Sigma conversion chart to determine the Sigma Level. As you can see below, the DPMO value falls between a Sigma Level of 2.750 and 2.625.
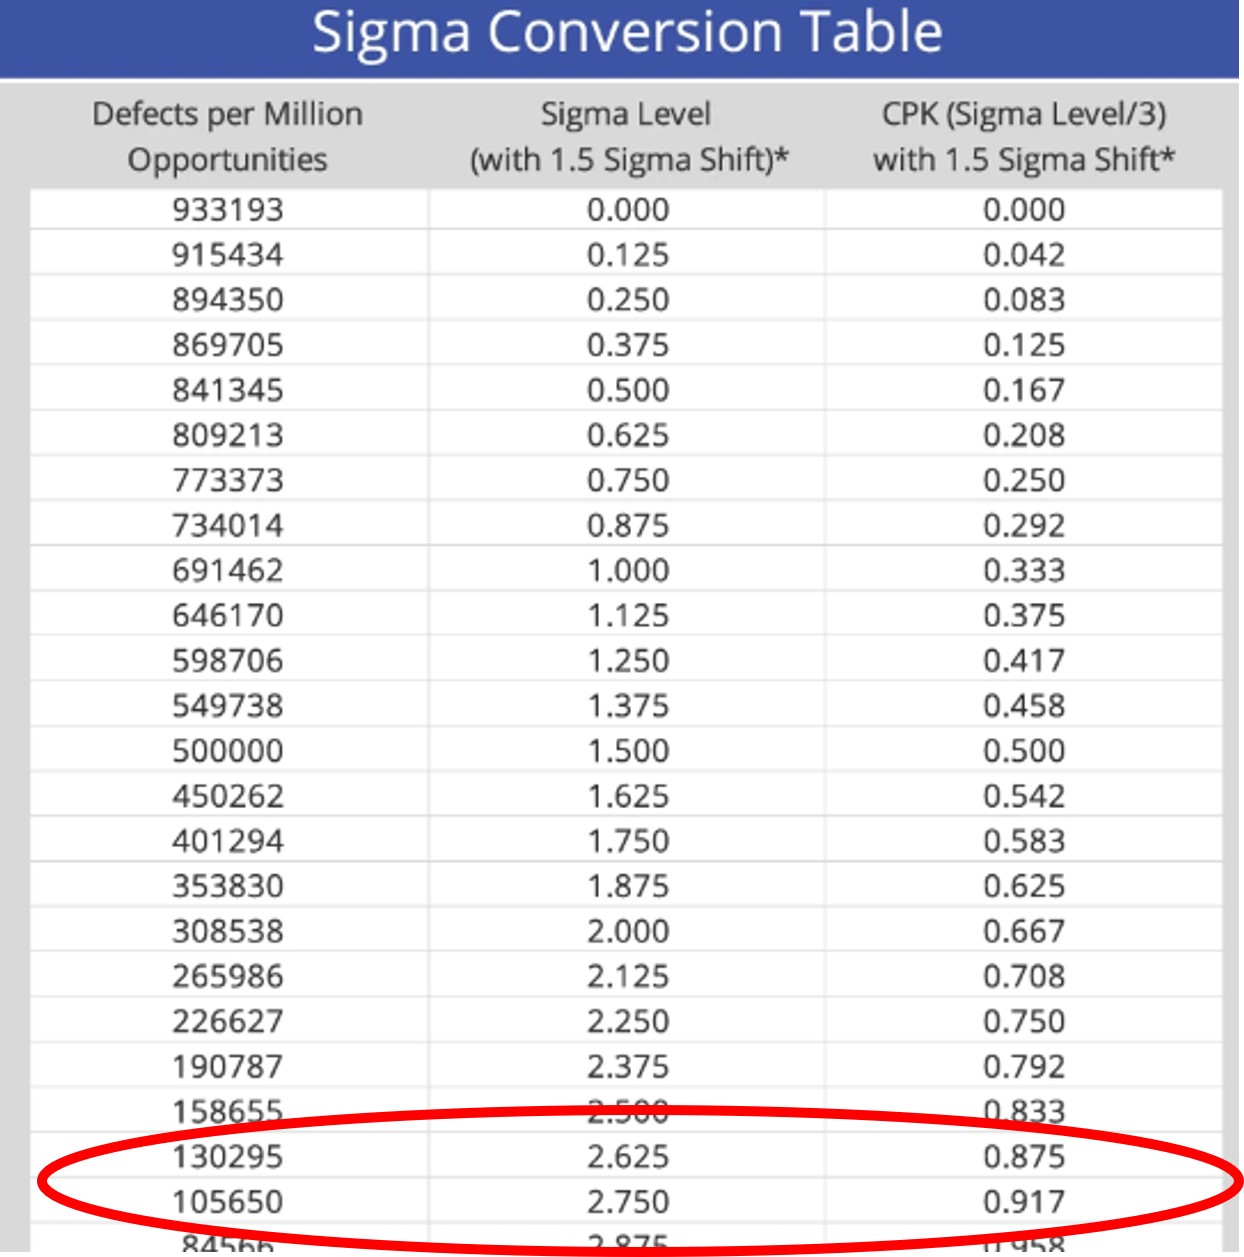
The final step in the process of conversion is to convert the Sigma Level to a Cpk value. According to the table, the estimated Cpk for this process would range from .875-.917. The minimum value of Cpk you should seek to achieve is 1.0 with values of 1.33 or 1.67 being preferred. A Cpk of 2 would be equivalent to a Six Sigma process.
Why It Matters
When you’re analyzing the data behind your processes, having a quick and effective means of converting between measurements is just a great way to save time. If you’re already adhering to the Six Sigma Methodology, you’re likely going to need all three of these measurements regularly.
As such, having a fast way to convert between measurements can help your organization aim for the ideal Sigma Level and DPMO needed to make your customers thrilled.
Other Useful Tools and Concepts
While we’ve discussed a bit on how to calculate these measurements and convert between them, there is still room for understanding other key metrics. For example, understanding how milestones or key performance indicators factor into your production workflow can help keep projects on track.
Further, understanding how throughput impacts your business goes a long way. If you’re new to the Six Sigma way of thinking, these are both key things to understand, especially if you’re in a leadership position.
Conclusion
Understanding how to convert between units like a Cpk value, Sigma Level, or DPMO is vital to improving your processes as a whole. Thankfully, you should have everything you need to make the most of your process improvement workflow.