Utilization of project management tools helps ensure the success of a project. One such tool is the Gantt chart.
At the beginning of the 20th century, Henry Gantt created a chart for recording the progress of workers when assigned to a task. His work revolutionized the field of project management, and his innovations are still utilized today.
Overview: What is a Gantt chart?
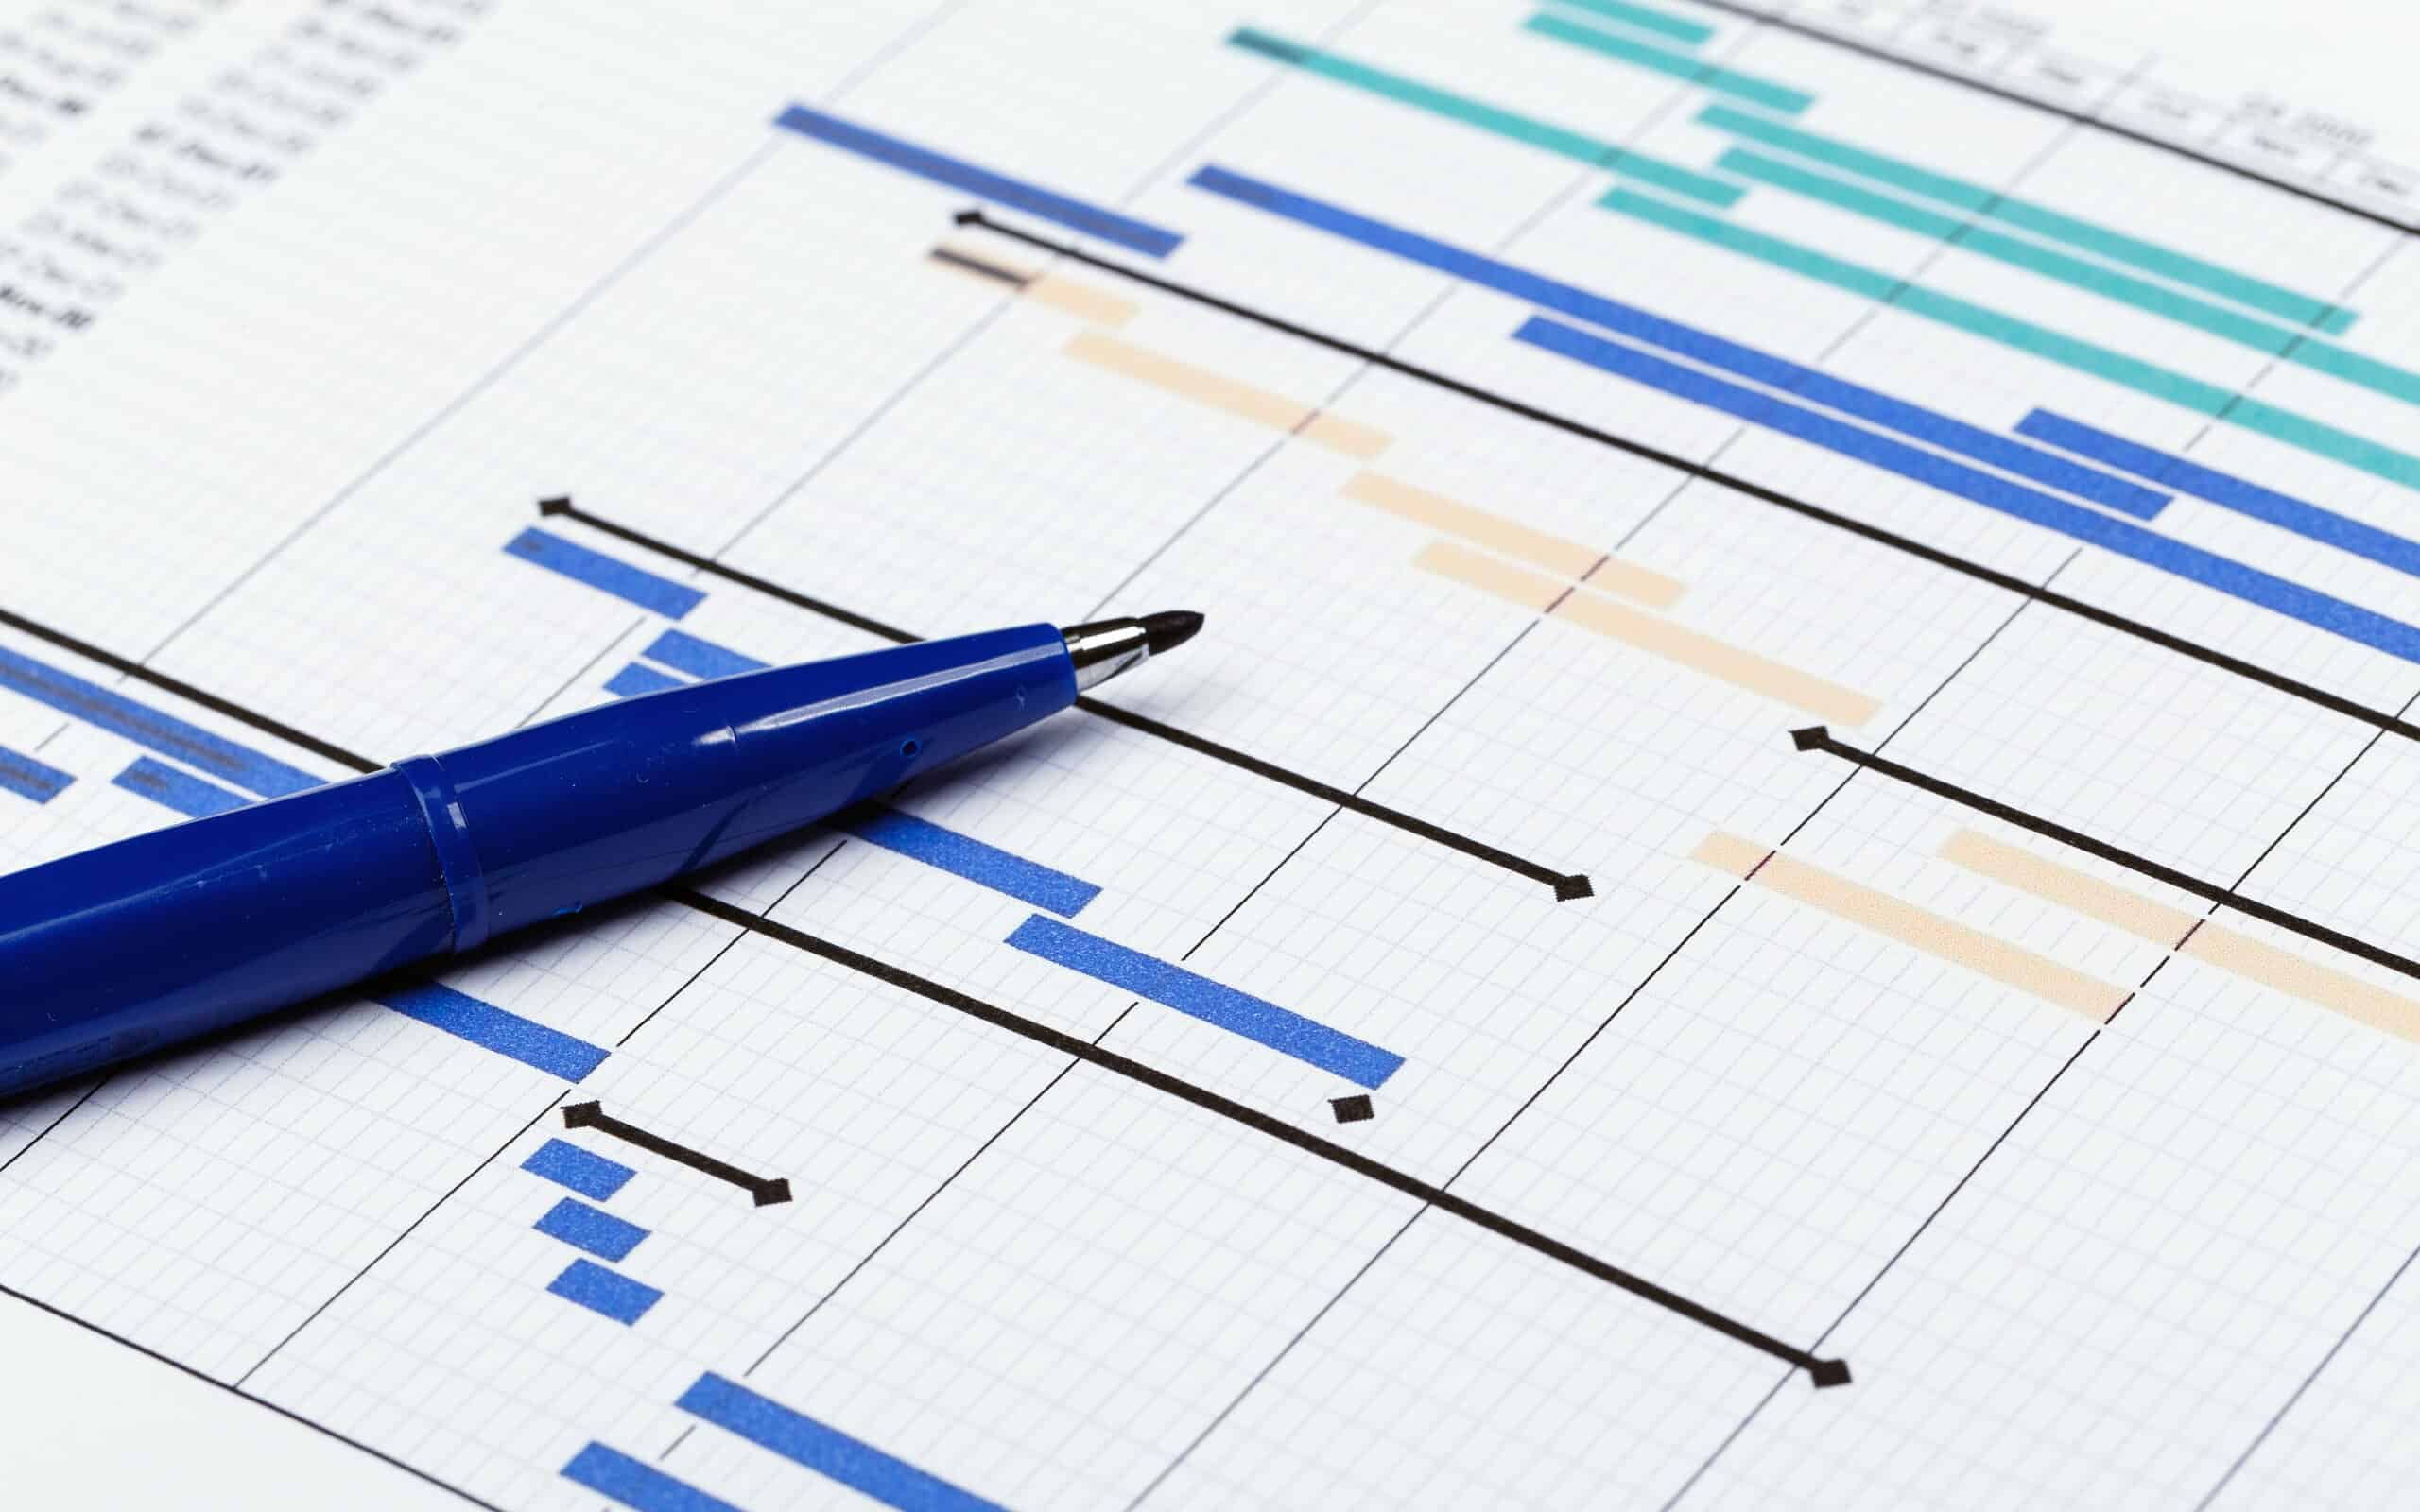
A Gantt chart is a project management tool. It illustrates the work done over time in relation to how much time was planned for the completion of the task.
3 benefits of a Gannt chart
There are some key benefits of a Gannt chart that have kept it in use and expanded upon for over a century:
1. Simplification
One benefit of a Gannt chart is that it helps simplify complicated plans.
2. Bird’s-eye view
Another benefit of a Gannt chart is that it provides a bird’s-eye view of a project, allowing project managers to get a fuller idea of a project’s scope.
3. Versatility
A Gannt chart can be utilized for a variety of applications in project management. For example, it can help teams adjust their plans around project deadlines as well as determine how to best distribute resources.
Why is a Gannt chart important to understand?
Understanding a Gannt chart is important for the following reasons:
Building and managing a project
A Gannt chart provides you with a tool for building and managing a project comprehensively. Understanding how to use it allows you to properly visualize what makes up a project and break it down into components that are more manageable.
Determine task dependencies
Understanding a Gantt chart allows you to spot task dependencies. These are tasks that must be finished before another task can begin.
Project monitoring
Knowing how to create and interpret helps ensure the proper monitoring of all stages of a project.
An industry example of a Gantt chart
A public radio station has decided to embark on an annual fundraiser. In order to make sure that it can best prepare for the proper allocation of resources in years to come, the project manager and team leader create a Gannt chart. This way, the team can know how long it takes to complete each task that goes into putting together the fundraiser, as opposed to how long they estimate each task will take.
3 best practices when thinking about a Gantt chart
Here are some key practices to keep in mind when working with a Gantt chart:
1. Utilize a Gantt chart for various methods of project management
A Gantt chart is just as well utilized for a waterfall project management style as it is for an agile approach.
2. Embrace technology for in-depth Gantt charts
For simpler projects, the various tasks to be kept track of on a Gantt chart require nothing more than a piece of paper or an office whiteboard. For complicated projects, the utilization of software is preferable. Several software options are available that are scalable to project goals.
3. Be mindful of how one task affects the other
A Gantt chart provides you with the opportunity to determine how one task could potentially impact your plan or the roadmap of a project. This is important to be mindful of so that your project stays in line with the budget and timeline.
Frequently Asked Questions (FAQ) about a Gannt chart
How is a Gannt chart different than a roadmap?
A Gannt chart is a detailed and linear schedule breaking down the tasks related to a specific project. A roadmap serves to communicate the goals and vision of a project.
When should a Gannt chart not be used?
A Gannt chart is not necessary when putting together the initial plan for a project.
What is a common mistake when using a Gannt chart?
It is common to not know how much to include in a Gannt chart. Putting in too little information regarding the tasks can make it impossible to properly estimate them. In turn, putting too much into the plan can make it seem too complicated and the tasks unachievable.
There is a reason why Gannt charts are still used today
Even though it is a project management tool that dates back over a century, countless project managers have continued to find value in utilizing Gannt charts in their projects. While the scope of Gannt charts has changed with the times over the years, at its heart, the tool works with the simple concept of checking the time to do a task with the amount of time that has been allotted for its completion.
A Gantt chart is a powerful and preferred visual reporting device used for conveying a project’s schedule.
A typical Gantt chart graphically displays the work breakdown, total duration needed to complete tasks, as well as % completion.
The Gantt chart itself will not display level of effort, and is not an effective planning tool on its own.
Gantt Charts may be integrated with other spreadsheet-type reporting devices that convey additional information related to project planning. Furthermore, Gantt Charts are often enhanced with functionality that includes the identification of relationships between tasks, and the ability to dynamically change task attributes.