
Overview: What is a Pareto?
Let’s start with a discussion of who Vilfredo Pareto was. Pareto was a French born Italian economist and sociologist whose work focused on the wealth distribution between the masses and elites.
From his early study of the distribution of wealth, Pareto developed the Pareto Principle which concluded that 80% of the land was held by 20% of the population. This principle became known as the 80/20 rule. The 80/20 rule has been applied, and found useful, in numerous economic and management situations and is one of the foundational concepts of quality improvement.
Dr. Joseph Juran, a quality management pioneer recognized the universal application of the Pareto Principle and referred to it as the vital few and trivial many where 20% of the causes are responsible for 80% of the outcomes. You might say 80% of your sales comes from 20% of your customers. Or, 80% of your problems come from 20% of your employees.
When Juran first defined this principle, he referred to the remaining causes as the trivial many before realizing that no problems are trivial, so he changed the phrase to vital few and useful many.
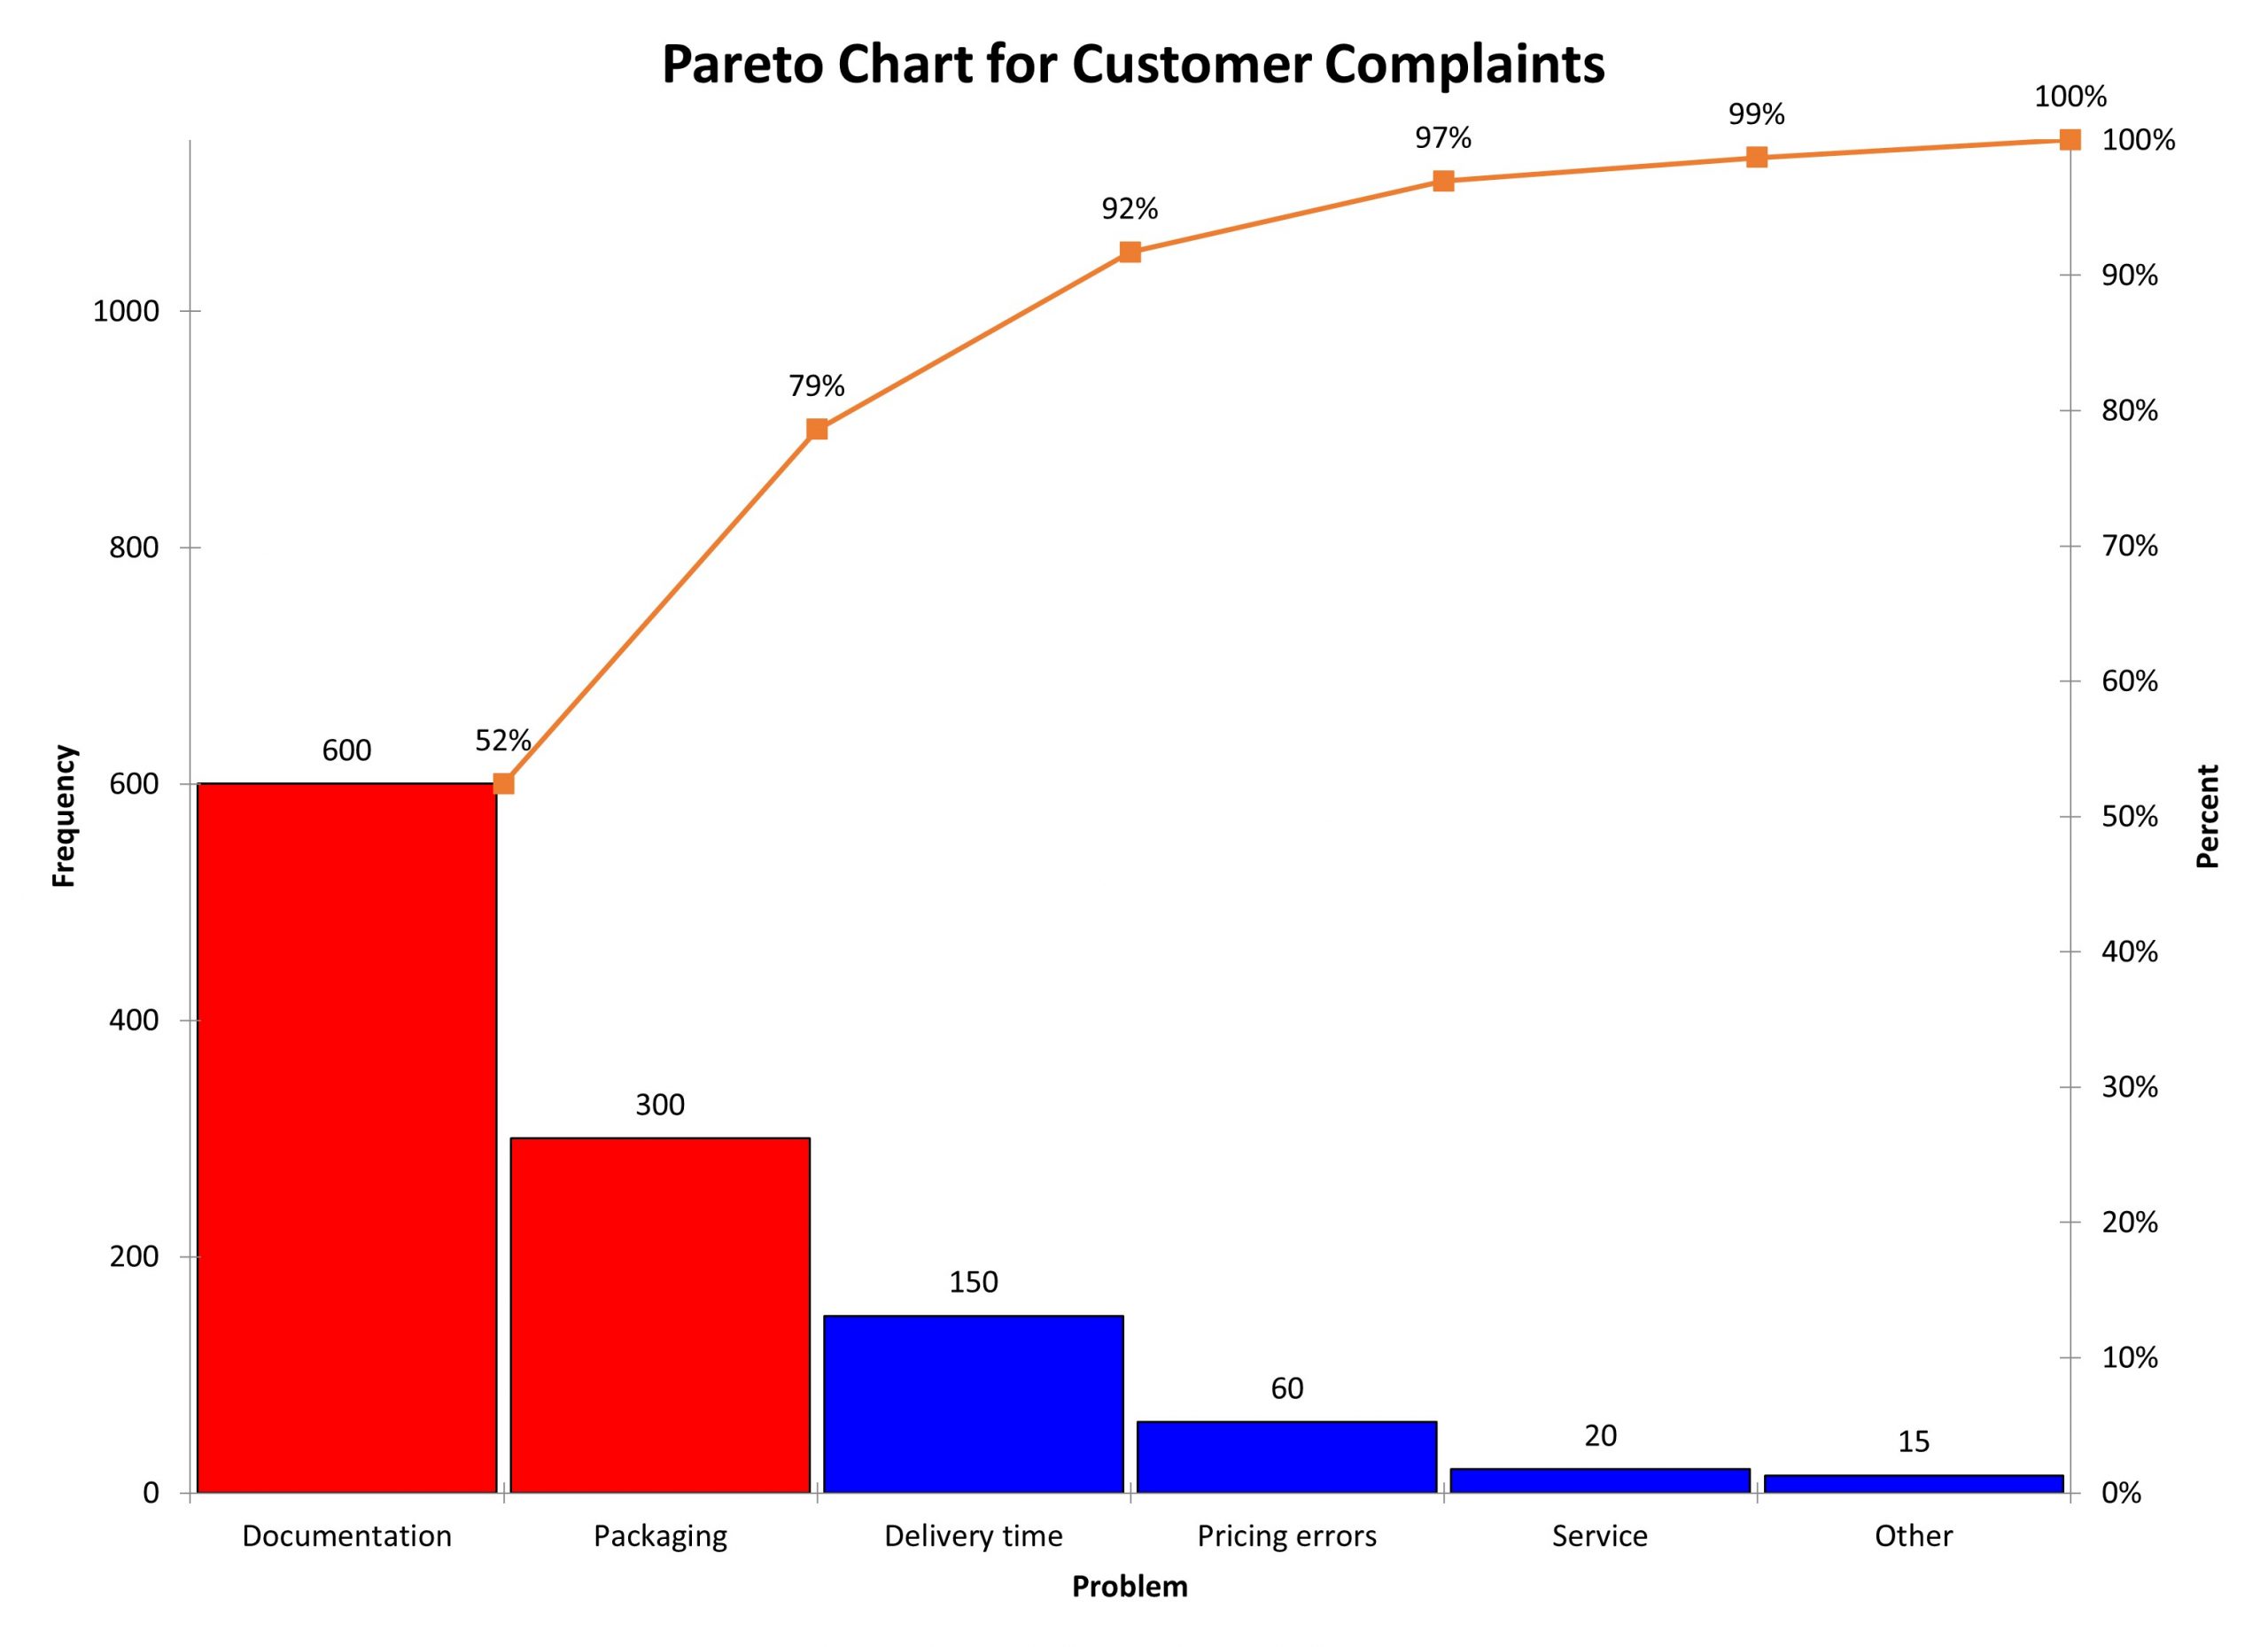
A Pareto chart is a bar graph. The heights of the bars represent the frequency of occurrence and are arranged with the tallest bars on the left and the shortest to the right. This way the chart visually shows which situations are the most significant. You would then take action on the causes which account for the most impact on your process.
You can see in the Pareto Chart below, that 79% of the reasons for customer complaints are accounted for by the first two reasons yet they account for 33% of the total number of reasons. You don’t have the pure 80/20 rule, but it is obvious where you should first look to reduce customer complaints.
An industry example of a Pareto
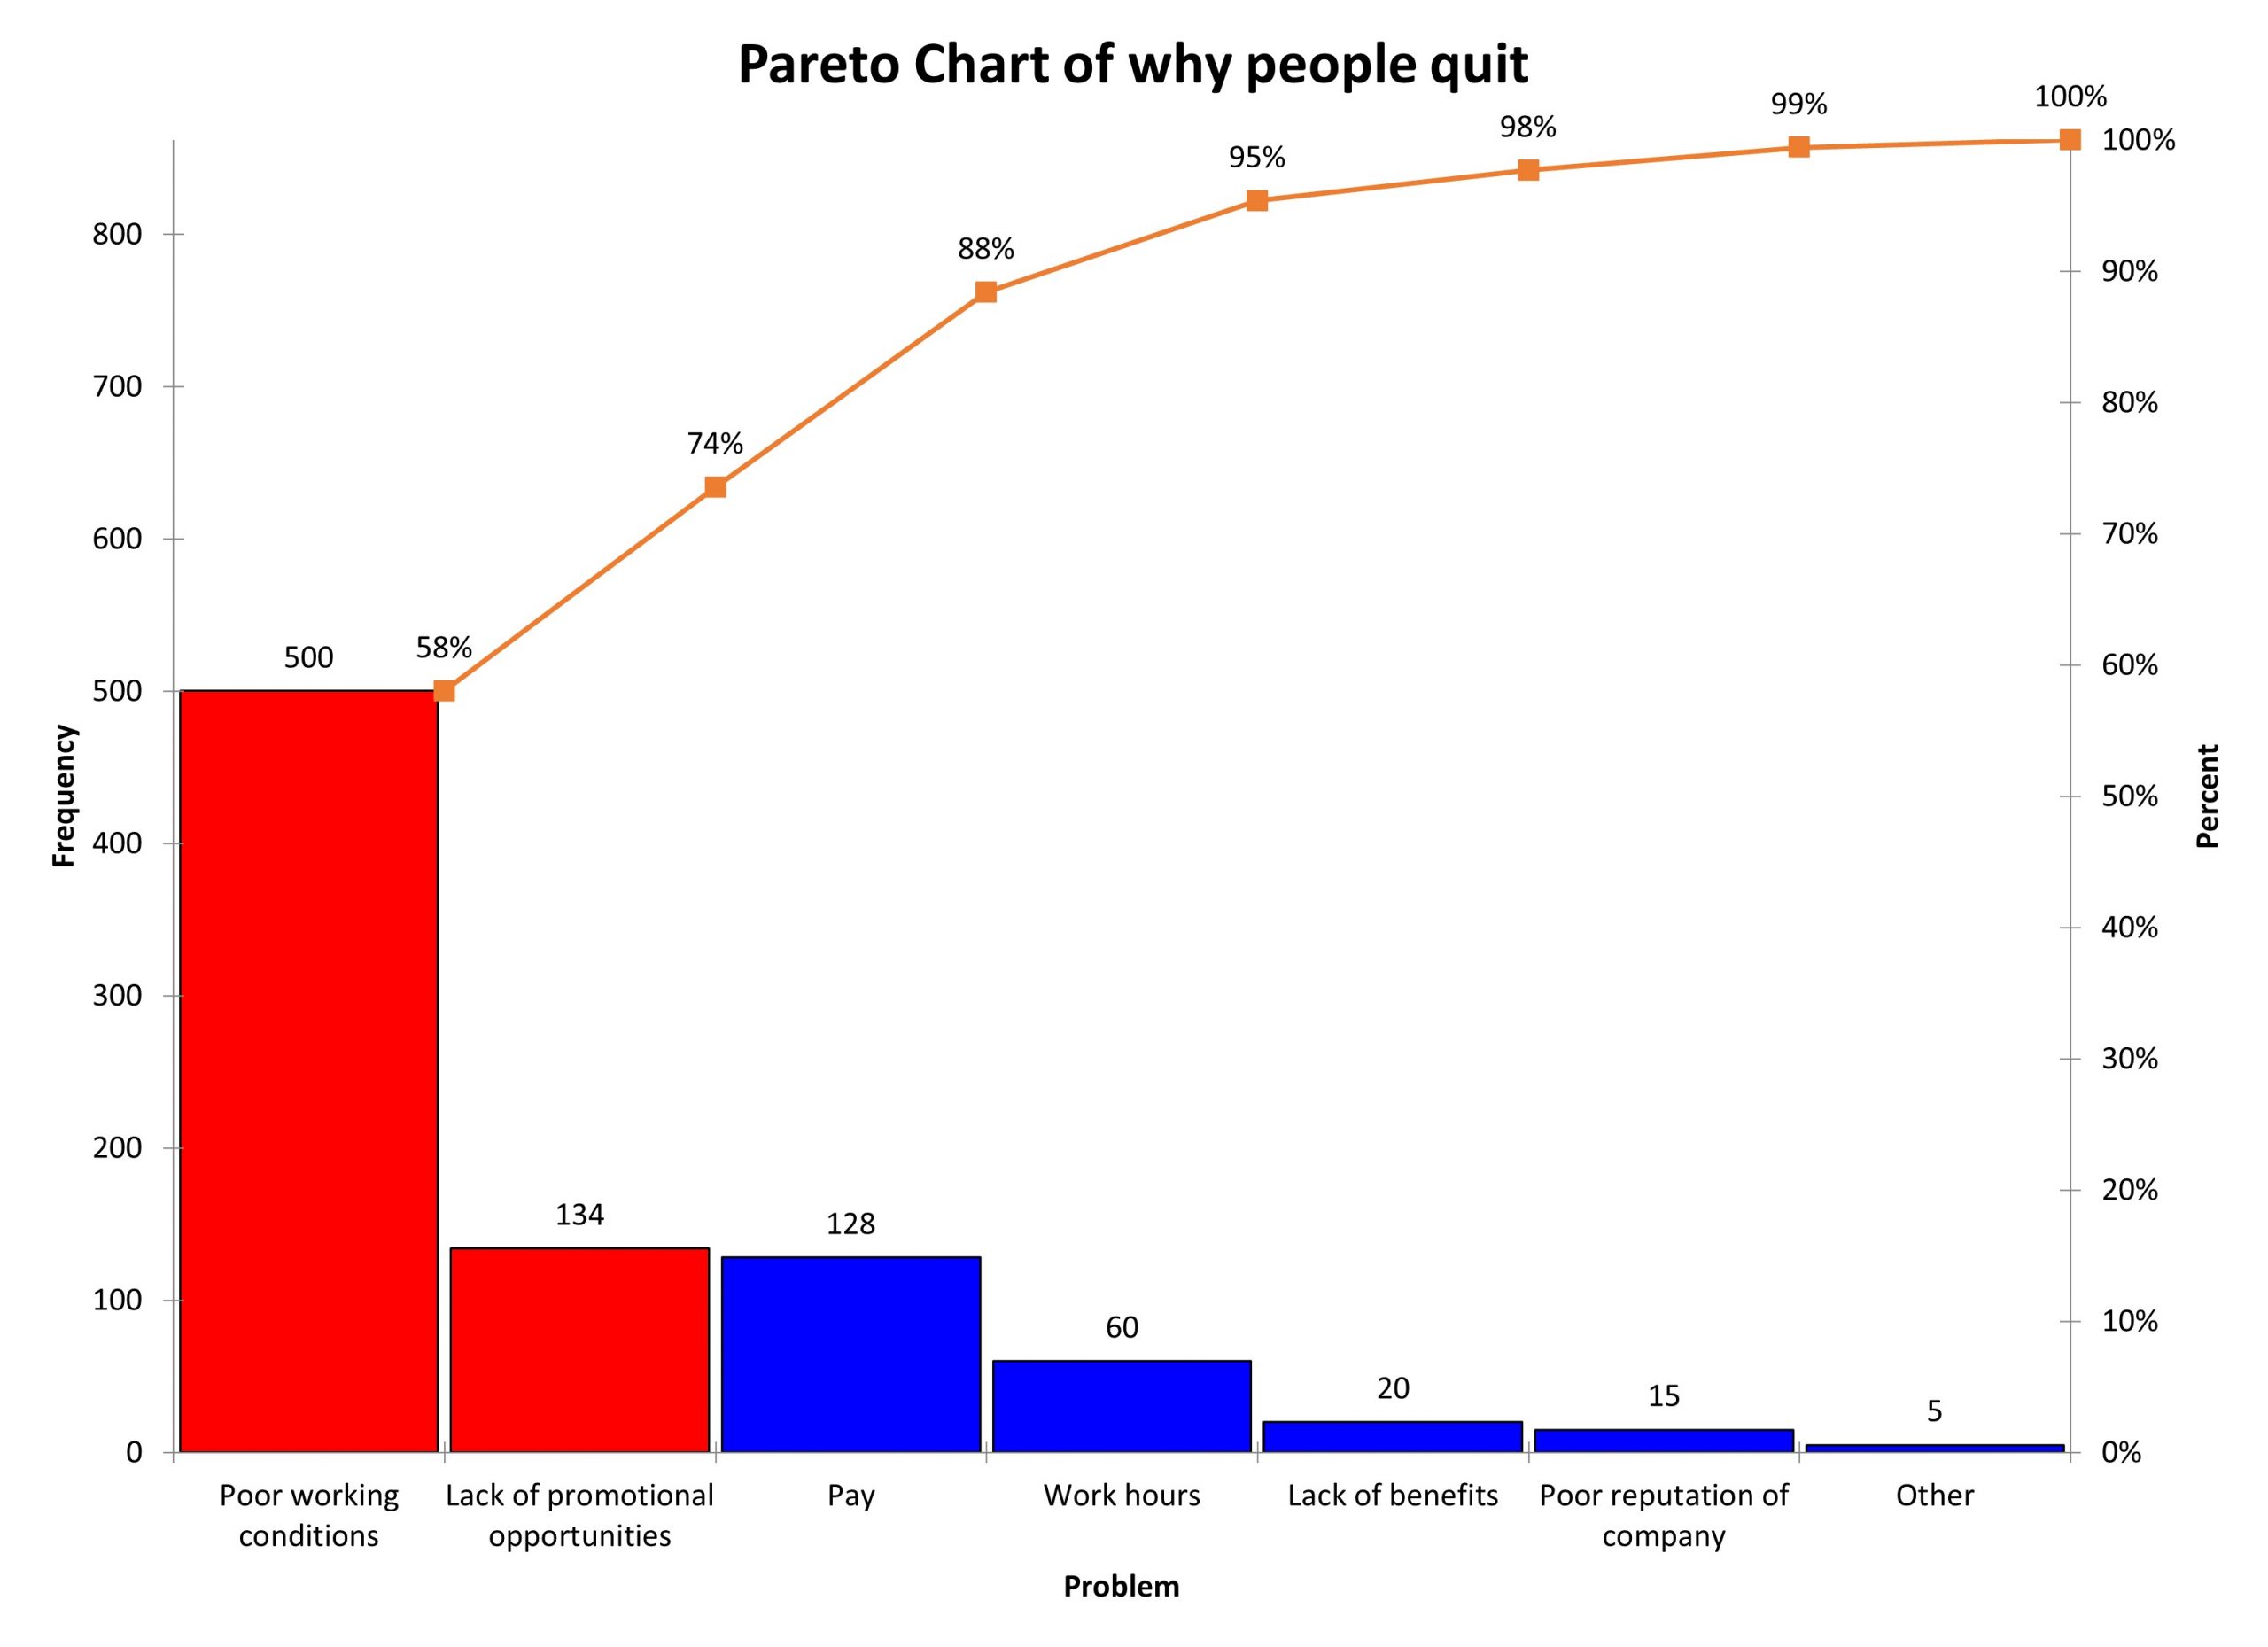
Human Resources was trying to understand the reasons for increased employee turnover. They started a process to do exit interviews and captured the reasons which are presented in the Pareto Chart below. You will notice that 74% of the reasons people quit is linked to 29% of the possible causes. This was determined from the top two causes accounting for 74% out of a total of seven possible causes (2/7 = 29%).
Frequently Asked Questions (FAQ) about Pareto
If my percentages are not exactly 80% and 20% can I still use the Pareto Principle to make a Pareto Chart?
Yes. Your numbers don’t have to be exactly 80/20 but the relationship should still illustrate that a small number of your problems are accounting for most of your outcomes.
What kind of data works best with a Pareto Chart?
Since the vertical axis on the left is to account for the frequency of occurrence of items of concern, it would be best to use discrete and countable data although some people use continuous data.
What if I can’t work on improving the highest bar, what do I do?
If current business conditions prevent you from starting to work on the highest and most impactful issue, just move on to the next highest bar. Do not knee jerk and seek to work on a low bar because improving that issue will not have an overall impact on the process.