
Key Points
- Discrete data is categorical data, rather than continuous measurements.
- It can be treated as continuous data, but that depends on the measurements set.
- It allows you to quantify things like pass/fail states, product colors, and more.
In this article, we present a distinct account of discrete data. By the end of our time together, you will be able to employ discrete data with certainty.
What Is Discrete Data?

©Ground Picture/Shutterstock.com
There are two categories of data:
- Continuous data is data that can be measured on an infinite scale, It can take any value between two numbers, no matter how small. The measure can be virtually any value on the scale. Measures of time, height, temperature, and thickness are all examples of continuous data.
- Discrete data is data such as occurrences, proportions, or characteristics (for example, pass or fail) and is counted (for example, the number or proportion of people waiting in a queue, or the number of defective items in a sample). Discrete data is counted in non-negative integers (1, 2, 3, etc.).
Take color, for example. Your product might come in five different colors or categories. You can count the occurrences of each color (category) in your data sample. Count is indivisible — it doesn’t make sense to have 1.5 blue products.
1 Benefit and 2 Drawbacks of Discrete Data
There are a few important things to know about discrete data.
It Provides Information About the Count of Items in Each Process Measure of Outcome Category
Discrete data can be summarized with a frequency table that shows the count of each category in the data sample.
It Requires More Data When Used in Graphical Analysis and Statistical Tests
Discrete data requires large sample sizes for graphs and statistical analysis. Collecting a large enough sample can be expensive in terms of time, money, and staff. On the other hand, it can be easier to collect than continuous data if you have clear definitions of the data categories.
Discrete data is less efficient than continuous data. It can tell you whether a product’s weight is defective, but it can’t tell you how much the product weighs.
It’s Only as Good as the Measurement System That Generates It
I call this a drawback, but measurement system analysis is the price of entry for discrete data analysis. Discrete data can be taken by both humans and machines.
It is important to make sure that the people sorting the data into categories (sometimes called inspectors) agree on the category for a given product.
Machines that provide count data must also be studied to determine that their output is trustworthy. It’s your responsibility as a discrete data analyst to study and correct any issues with your inspectors or measurement equipment before analyzing the data it provides.
RELATED: DISCRETE VS. CONTINUOUS DATA
Using Discrete Data As Continuous Data
So, it might seem like you’re stuck in a single way of measuring discrete data. However, given your specified measurement systems, you can use discrete data as a continuous data stream. This isn’t going to work for the likes of pass/fail states, but for the likes of count data, it works wonders.
Why Is Discrete Data Important to Understand?

You must determine if the data generated by processes measures and/or process outputs is discrete in nature in order to do the following two things.
Choosing the Right Statistics to Describe the Sample
Discrete data may be summarized by counting occurrences of each category. You might also like to calculate the proportion (or percentage) of occurrences of a category in a sample.
Choosing the Right Analysis Tool
The tool you want to use in graphic or statistical analysis will specifically require either discrete data or continuous data.
If, for example, you accidentally use discrete data for a tool that requires continuous data, you can draw incorrect conclusions from the tool’s output. If you act on those incorrect conclusions, you may not get the results that you wanted, wasting both time and money.
An Industry Example of Discrete Data
Discrete data from a curing oven test (pass/fail the test) was collected to check if the curing oven could be used for a new product. The engineer wants to check how many times the oven test failed or passed. The engineer needs to:
- Verify the curing oven test pass and fail can be correctly identified with a Gage R&R Study. Assuming the gage passed…
- Make 30 curing oven tests over the course of one day of curing the new product. Classify each one as pass (in the temperature range for the new product) or fail.
- Plot the data in a bar chart.
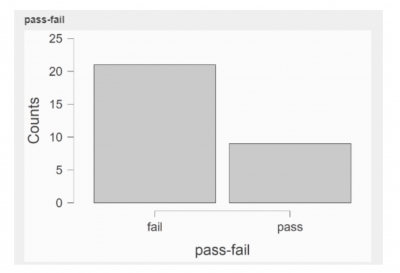
The bar chart of the 30 discrete data points has 20 fails and 10 passes.
What can this discrete pass/fail data tell us about the curing process?
- The discrete data tells nothing about the center or spread of the data, only how many readings passed the curing oven test and how many failed.
- There are twice as many curing oven fails as there are passes. That is not good news.
- The discrete data can tell us how many more failed curing oven tests there are than passed tests. However, the discrete data cannot tell us if the curing oven fails or is too cool or too hot. For that, we need the temperature continuous data.
Based on what they learned from the discrete data bar chart, the engineer decided to take action and study the curing oven components.
A mechanical check of the oven showed the thermostat was not functioning. It was replaced. The number of tests that fail is now 0, and the curing oven is good to use with the new product.
Discrete Data Best Practices
If you want to analyze data like an expert, keep these three things in mind.
Use Excel or Other Software for Data Analysis
The days of plotting discrete data in frequency tables and calculating discrete data statistics by hand are long past. Find an analysis program that suits your needs and your budget.
Your company may allow you to download Minitab, JMP, or Excel. If not, you can search for free, open-source statistics software on the web. “R” software, for example, is free and used by many universities.
Assess Data Stability Before Beginning Analysis
Before you use discrete data to represent your process measure or outcome, it’s important you know whether your process is in statistical control.
If your discrete data plot is not stable, you should do some process improvement work to move it toward stability.
Analysis of discrete data that is unstable only applies to that sample of discrete data. If the process is under statistical control, the analysis of the discrete data may also apply to the process samples shortly.
Plot the Data
A picture is worth a thousand words. Statistics support the graphs — not the other way around. Always begin discrete data analysis with frequency tables, a bar chart, and a control chart.
Other Useful Tools and Concepts
Looking for some other tools to help your organization? You might be best served by looking into how the machine capability index works. This is a short-term capability index used to analyze the performance of a machine in a given project.
Additionally, you might want to take a closer look at how the Toyota Production System works. TPS is a great approach to improving business processes and bolstering your quality output.
Conclusion
Discrete data are “category” variables, (e.g. color, defect type, or pass/fall) or ordered rating scales (like Likert scales for strength of agreement). Analysis of discrete data can tell you the occurrence or proportion of categories in a sample.
While discrete data will not give you as much information about your sample as continuous data can, it is still useful and informative of your process measure or outcome.