
Overview: What is the range?
The range of your data is simply defined as the mathematical difference between the highest and lowest values in your data set. It represents the extremes of your data but doesn’t tell you anything about the dispersion or variation of the data between those extremes. For example, if your data set is 2, 5, 8, 9, 9, 12, 15 then your range will be 15 – 2 = 13.
But if your data set is 2, 2, 2, 2, 2, 2,15 then your range is still 15 – 2 = 13. Or, if your data set is 2, 15, 15, 15, 15, 15, 15 then your range will once again be 15 – 2 = 13. The range tells you nothing about the variation of your data within that range.
Since you are taking the difference between the highest and lowest values, the value of the range will always be a positive number unless the high and low values are the same. Then your range will be zero.
An industry example of the range
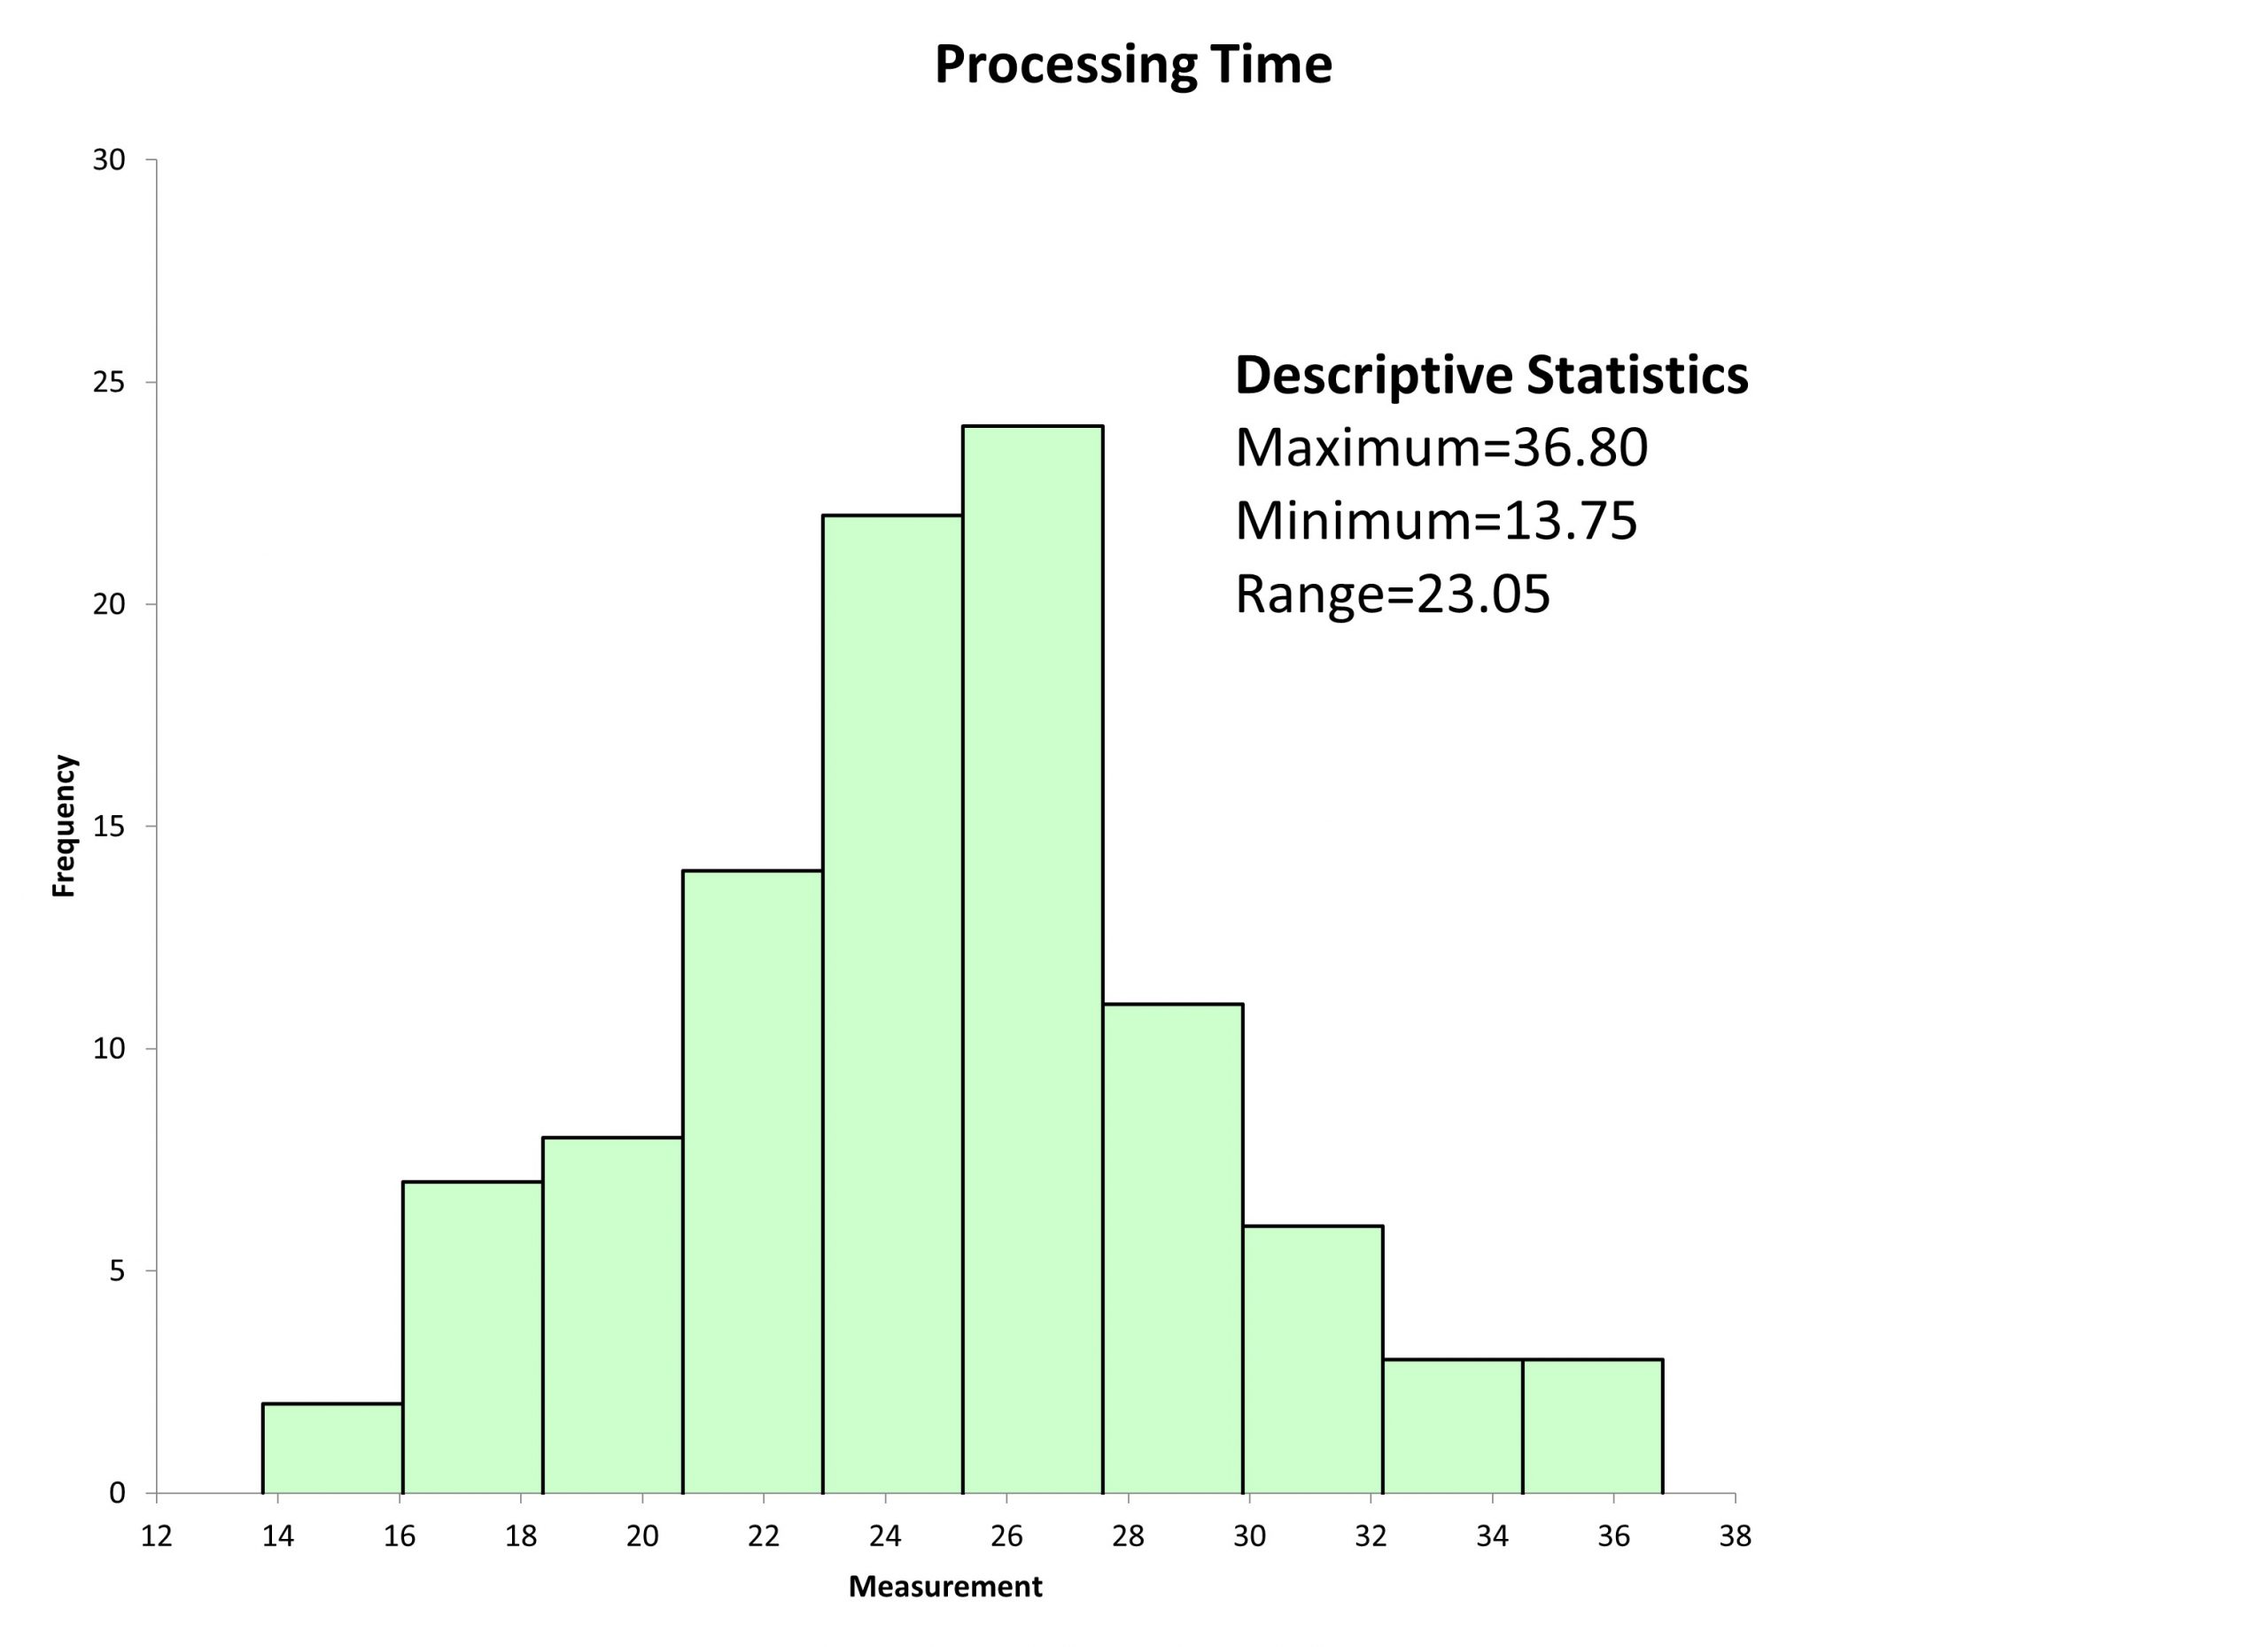
The Finance Manager was interested in the variation of time it takes her accounts payable clerks to process invoices. Since she was a Six Sigma Green Belt she felt comfortable using her statistical software to make a histogram and compute the range. Below is her output:
Frequently Asked Questions (FAQ) about the range
What is the smallest value the range can be?
The smallest value will be zero if the high and low values in your data are the same.
Is the range a good measure of the variation of my data?
No. It only tells you about the extreme values of your data. It doesn’t provide any information about the variation or dispersion of the data points between those extremes.
What are the units of measurement for the range?
Since the range of your data is the mathematical difference between the maximum and minimum values of your data, the range will be expressed in the same units as your maximum and minimum values.