
There are three measures of central tendency for data. One is the mean or x-bar, and the others are the median and mode. When you’re diving into statistical analysis, these are basic components. Most practitioners should have encountered these in grade school, but a refresher never hurts. Let’s dive into what it means.
Overview: What Is X-bar?
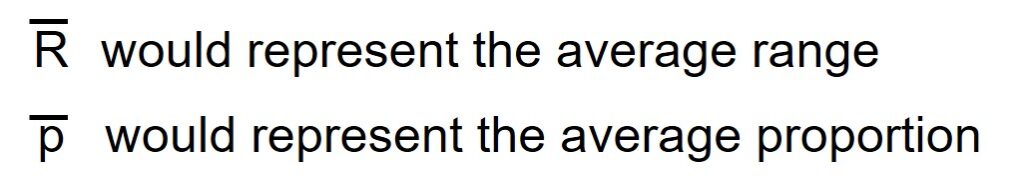
In statistics, the Latin small letter x is used to represent a variable in a set of sample data. A horizontal bar over a letter indicates the letter represents the average or mean of whatever the variable represents. For example:
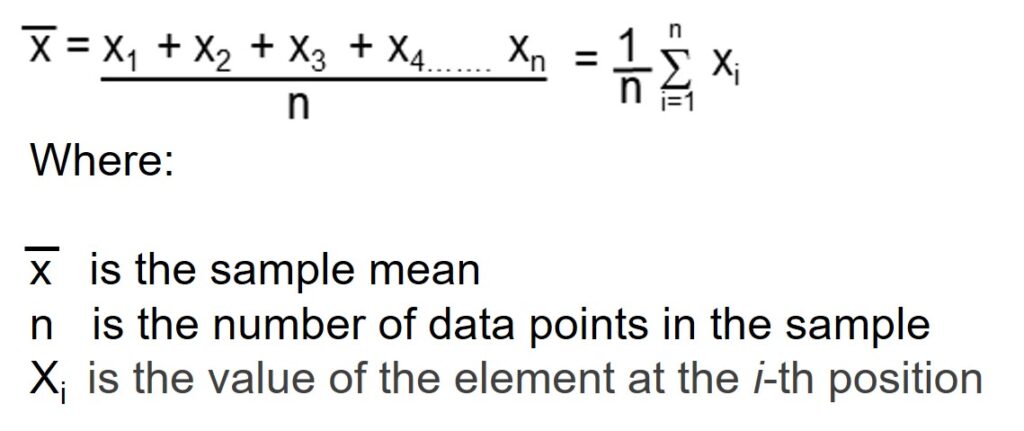
To calculate the x-bar or sample mean, you would sum all the data points in the sample and then divide by the number of data points. This will be represented by the following formula:
However, there is a caveat for using the mean as a measure of central tendency. Beware that the average of a data set can be skewed by an outlier on the high or low side.
An Industry Example
The Manufacturing Supervisor wanted to know the average number of pieces produced per day on his machine. He asked the local Six Sigma Green Belt to help collect the data and do the calculations. Below is the sample data for 30 days of production and the calculation for the x-bar or average number of pieces produced per day. It is just a matter of adding up the 30 daily data points and dividing by the number of data points which was 30.

Mean or x-bar = 1174 pieces
Other Crucial Analysis Tools
Now that you have foundational knowledge of how to calculate the mean of your data, it’s time for headier subjects. While these can seem daunting at first glance, they aren’t that bad. Understanding how the UCL, or upper control limit, of your data is established is a great means of improving your grasp of statistical analysis.
Further, you might want to look into the RPN or risk priority number. This is a bit more complicated for those who aren’t that math-savvy. However, the core concept is relatively straightforward. Once you’ve understood it, you’ll be more than ready to start tackling risk management with the knowledge gained.
Wrapping Up
Understanding the basic components of your statistical analysis is crucial. When you consider that this is just scratching the surface of what is present in Six Sigma for statistical analysis, having a strong foundation helps the other pieces fall into place.