
There are two key statistical descriptors you can use to describe a data set. One is the central tendency and the other the variation. The mode is one of several descriptors of central tendency.
Overview: What is the mode?
There are three metrics used to describe the central tendency of a data set. One is the mean, which is the mathematical center of the data. A second descriptor is the median, which is the physical center of the data after you have ordered them either high to low or low to high. The mode is the third descriptor.
The mode is defined as the most frequently occurring value in the data set. Of the three descriptors, the mode provides the least amount of information about the overall distribution of the data. It is interesting since it will be the high point on a graph such as a histogram, dot plot, or stem and leaf plot.
You may also observe that your data has multiple modes or high points. This is usually an indication you have combined different sets of data with different central tendencies. If this is the case, it is recommended you break out the different data sets and analyze them separately.
An industry example of the mode
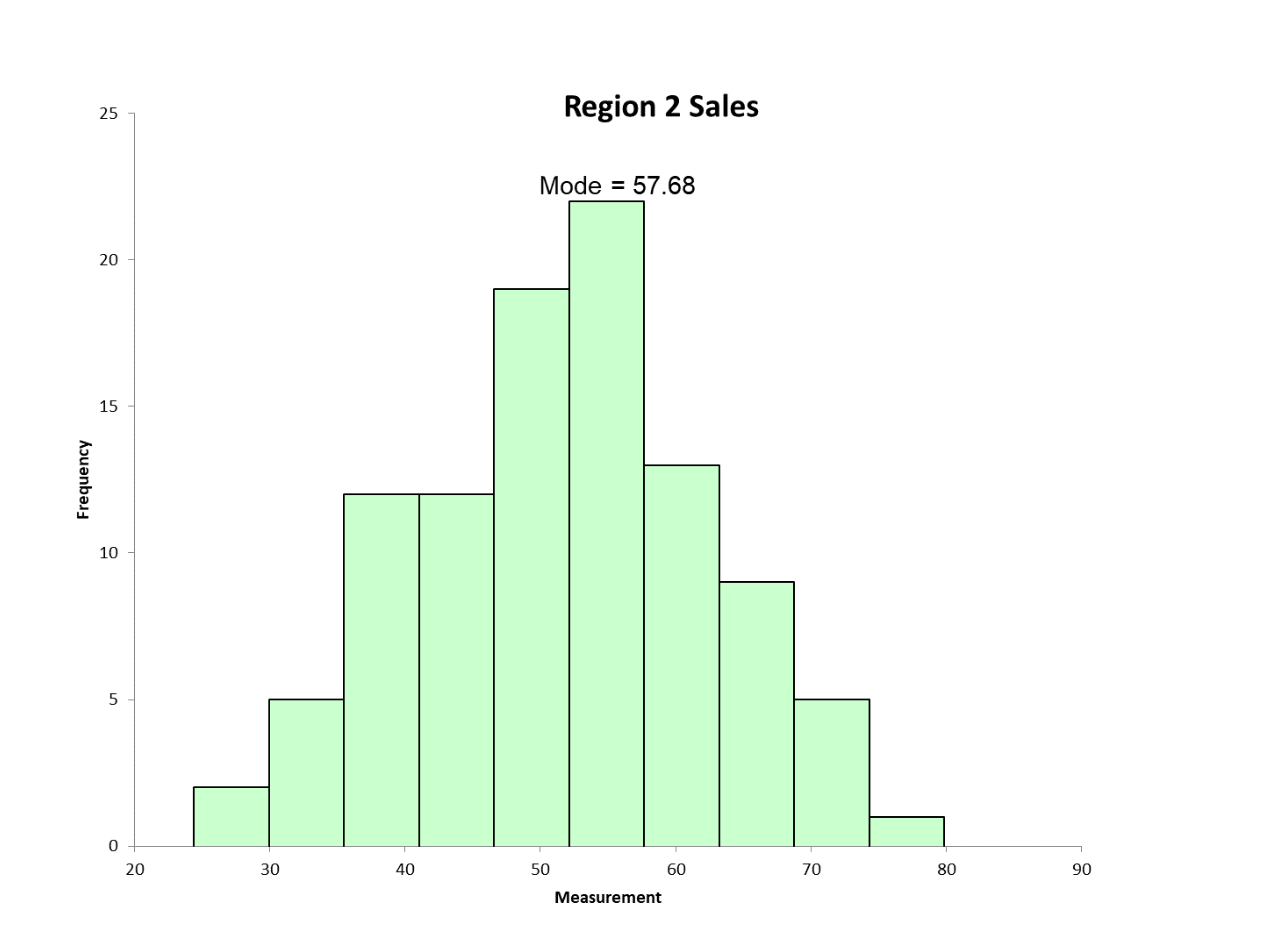
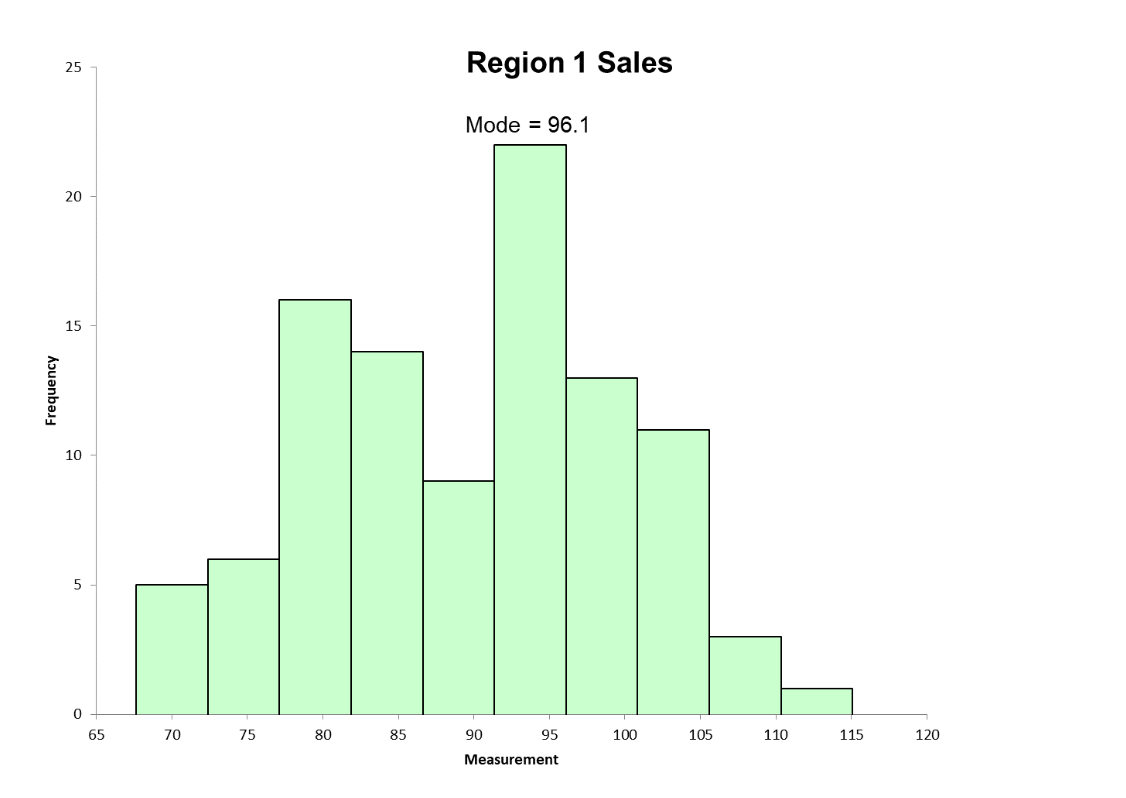
A Six Sigma Black Belt(BB) was analyzing some sales data which can be seen below in graphical format. Note the existence of a bimodal distribution. After investigating further, the BB realized she had accidentally combined two regions. She broke them out and was then able to look at them separately.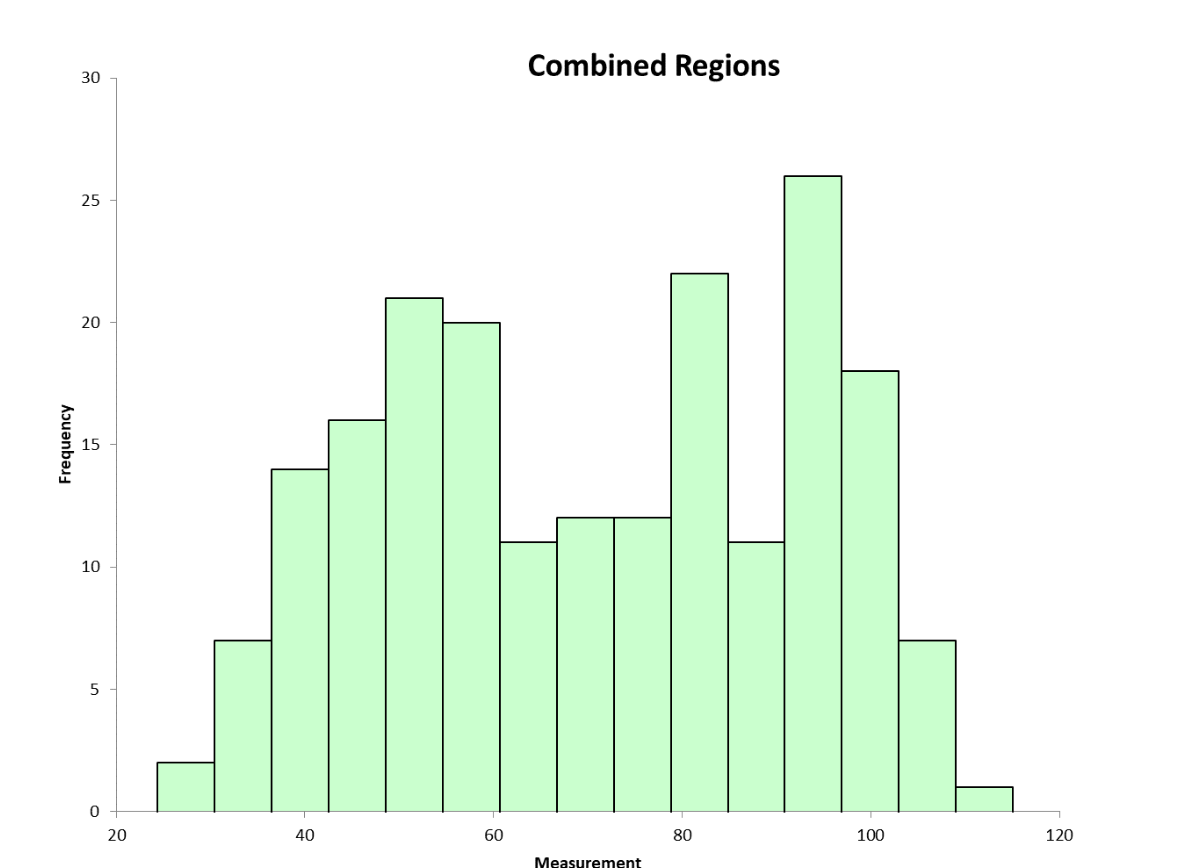
Frequently Asked Questions (FAQ) about the mode
What does the mode actually measure in my data?
The mode represents the most frequently occurring value in a set of data.
Can I have more than one mode in my data?
Yes. You can have two modes which you would call a bi-modal distribution or even more. Multi modes are usually a result of combining two different sets of data with different levels of the mean. This will typically show up in a graphical format such as a histogram or dot plot.
When is the mode an important measure of central tendency?
The mean and median are better measures of central tendency. The mode becomes interesting when you have more than one mode. This will usually indicate you have combined different groups of data and should consider analyzing them separately.