A bad taste can prevent some people, particularly the young and the elderly, from taking a medication – which can endanger their health. Taste can also influence what over-the-counter drugs people purchase and the choice between generic and brand-name medications.
Because taste is such a key factor in compliance and purchasing decisions, optimizing taste is a crucial step in pharmaceutical development. In the following Design for Six Sigma (DFSS) case study, modified to exclude proprietary information, a pharmaceutical company uses the Identify, Design, Optimize, Verify (IDOV) roadmap to develop the taste of an orally dosed drug.
Identify
The problem that had to be solved with this project was the bitter taste of the active pharmaceutical ingredient (API) for the drug in development. Using an electronic tongue, the team measured the bitterness of the drug’s API. The electronic tongue value was put into a partial least squares (PLS) correlation model, which was based on bitter substances. The API’s bitterness fell into the model’s “non-acceptable” range.
Because the developers were aiming to produce the first generic version of this drug on the market, a bad taste was out of the question. The objective therefore was to optimize the masking of the API’s taste, enabling it to reach acceptable levels on the bitterness scale, while maintaining the current time-to-market prognostics.
The project’s critical-to-quality (CTQ) factor was the masking efficiency of the formulation matrix, which includes all the agents, such as solvents, stabilizers and additives, used to make the formulated product. The CTQ was defined as the taste difference between an active formulation – made up of the API and the formulation matrix – and a placebo formulation, which is the formulation matrix alone. Ideally, there should be no difference.
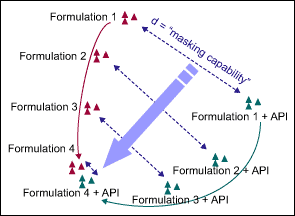
The developers compared the tastes of different formulations, measured with electronic tongues, by using a principal component analysis (PCA) of the raw data. They mapped the taste, which is measured in seven dimensions, in two principal dimensions – the two that capture the most variation. A sample map, comparing four different formulations, in both their active and inactive states, is shown in Figure 1.

The shorter the distance is between a pair of inactive and active formulations, the less of a bitter taste. In an optimal situation, the consumer cannot “feel through” the bad taste of the API in the final formulation matrix, meaning the active and placebo formulations taste identical and have the same position on the PCA map. In Figure 1, Formulation 4 is clearly the best choice to cover the bad taste of the API.
After the team members selected the measurement system, they evaluated the system’s repeatability using the same formulation matrix. They found the mean error was less than 1 percent.
Design and Optimize
The taste of any formulated drug depends on the API itself, as well as on the kind and concentration of compounds in the formulation matrix used to mask the API. In this project, the backbone of the formulation was given – an orally dosed liquid. Certain taste-masking agents, notably texture, or complexing agents, were excluded from the taste optimization due to preliminary indications of stability problems. This left the team with two major additive options: sweeteners and fruity flavors.
The target branded drug had a fruity flavor and marketing confirmed that this was the user preference; although the branded drug did not use caloric sweetener, e.g. sugar, it was not ruled out by consumer-preference studies. From a manufacturability perspective, adding more than two sweeteners and more than one aroma was not acceptable.
Given these constraints and the timeline, the team adopted a three-part design-of-experiments (DOE) approach:
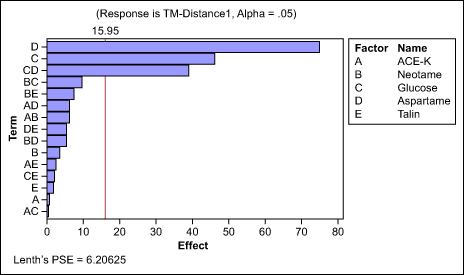
Sweetener selection: The team screened the most-common sweeteners for masking effect – acesulfame potassium (Ace-K), aspartame, talin, glucose and neotame – with a 1/2-factorial design (Figure 2). Because the main and second-order interaction effects were safely identifiable, this design was largely sufficient to select one, or a combination of two sweeteners, as the lead additive.

The results indicated that aspartame, glucose and the interaction effects between the two ingredients were the most important. The team retained these for further optimization.
Aroma selection: The team tested a series of aromas from two families, all at the same concentration level, with the selected sweetener combinations. The aroma families were red berry (raspberry, strawberry and blueberry) and citrus (orange, lime and lemon). First, the developers ran a one-way analysis of variation (ANOVA) to determine aroma’s ability to impact the taste-masking distance, and if an impact was detected, which family provided better masking abilities (Table 1).
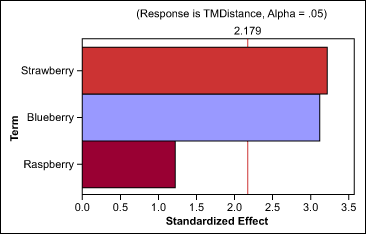
The team found that aroma does decrease the taste-masking distance, and that berry aromas have better masking abilities than citrus families. Based on these results, they also completed individual tests on each member of the berry family (Figure 3). The tests showed that blueberry and strawberry provided the same masking effect. In other words, neither one had more impact on taste distance than the other, within the measurable error of the instrument.
| Table 1: One-Way ANOVA: Taste-Masking Distance Versus Family | |||||
| Sources of Variance | Degrees of Freedom | Sums of Squares | Mean Squares | F-Statistic | P-Value |
| Family | 1 | 10542 | 10542 | 11.43 | 0.004 |
| Error | 14 | 12913 | 922 | ||
| Total | 15 | 23455 | |||
| S = 30.37 R-Sq = 44.95% R-Sq (adj) = 41.01% | |||||
| Individual 95% CIs for Mean Based on Pooled StDev | |||||
| Level | N | Mean | StDev | —–450———475———500———525—– | |
| Berry | 8 | 463.21 | 39.25 | (——–*——–) | |
| Citrus | 8 | 514.55 | 17.44 | (——–*——–) | |

Sweetener and aroma concentration: The team optimized the concentration of glucose, aspartame and blueberry aroma within the formula by using the response-surface method (RSM). Within the experiments, they varied aspartame between 0.02 mg/ml and 0.1 mg/ml, glucose between 5 mg/ml and 25 mg/ml, and blueberry between 1 mg/ml and 15 mg/ml. The response-surface regression results (Table 2) were used to find the RSM coefficients for the ingredients of choice.
| Table 2: Estimated Regression Coefficients for Taste-Masking Distance | ||||
| Term | Coef | SE Coef | T | P |
| Constant | 650.4 | 29.82 | 21.813 | 0.000 |
| Aspartame | -7865.0 | 816.17 | -9.637 | 0.000 |
| Glucose | -1.6 | 0.60 | -2.688 | 0.021 |
| Blueberry | -14.0 | 3.60 | -3.895 | 0.002 |
| Aspartame*Aspartame | 41689.6 | 6683.70 | 6.238 | 0.000 |
| Blueberry*Blueberry | 0.7 | 0.22 | 3.278 | 0.007 |
| S = 13.29 R-Sq = 97.4% R-Sq (adj) = 96.3% | ||||
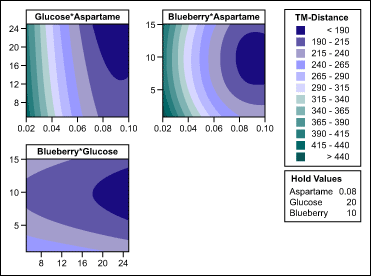
The experiment confirmed that using both sweeteners was beneficial. The team identified the lead formulation candidate as 0.08 mg/ml aspartame, 20 mg/ml glucose and 10 mg/ml blueberry aroma. As illustrated in the contour plots in Figure 4, this combination lowered the taste difference for the API from more than 500 taste units to about 180 taste units – almost 75 percent masking. Masking to such an extent meant there was a significantly improved taste and that the bitterness was likely within acceptable levels.

Verify
The team made the predicted best formulation to lab scale and as a semi-pilot prototype. When measured, these candidates showed 74 percent and 70 percent masking respectively, further confirming the team’s design choice. The developers also compared this design with current branded drugs; it showed a slight – about 5 percent – superiority in masking efficiency. The true and final verification, however, would come with the first large-scale trial, where feedback on taste would be collected.
Conclusion
With this structured approach, the team could define the optimal formulation in less than three months, allowing for the product to be marketed on time with the required taste profile.
The example shows that an IDOV project does not have to be complex or very long – as long as the project is focused on what matters.