Bulked continuous filament (BCF) carpet yarn manufacturing is a commodity product for which production from a single plant can be measured in the hundreds of millions of pounds annually. Hundreds of draw-texturing positions produce 15-pound bobbins of textured yarns continuously – as many as 3,000 in a month from a single position – which are then sold to carpet manufacturers. The carpet manufacturer usually plies these yarns, heat-sets them and then stitches the plied yarns into carpets. For a cut-pile fabric, the carpets are sheared to form the tufted surfaces found in many home carpets.
A number of BCF carpet yarn characteristics, such as yarn bulk and dyeability, must be closely controlled by the fiber producer. A single yarn end that is different enough from the rest of the population can appear as a streak in the final carpet for hundreds of yards. In some cases, that streak can cause the fiber producer to incur tens of thousands of dollars in claims.
In November 2005, a BCF yarn manufacturer charged my Six Sigma team with installing systems to reduce their percentage of off-grade material by 4 percent to enable that gain to be forecast for 2007. This would be significant for the manufacturer because in the prior two years it had produced more than 11 percent off-grade yarn, worth an estimated $27 million. The eight-person team that led the effort at two plants was so successful that the systems were put in place in time to realize the actual savings in 2006 – one year ahead of schedule.
Because yarn manufacturing involves lots of people and many independent machines striving to make an identical product, accountability for both machines and people can be an issue. Learning to improve operator, equipment and product accountability were major teachings from this Six Sigma project team. The following case study outlines how the team went about improving accountability, in part by characterizing positional performance.
Accountability of People
At this manufacturing company, more than 150 operators maintained just under 1,000 texturing positions continuously over four shifts. Typically, each person was responsible for 20 positions that were grouped by machine into rows where two operators could roam an aisle to oversee their respective positions and help one another when needed.
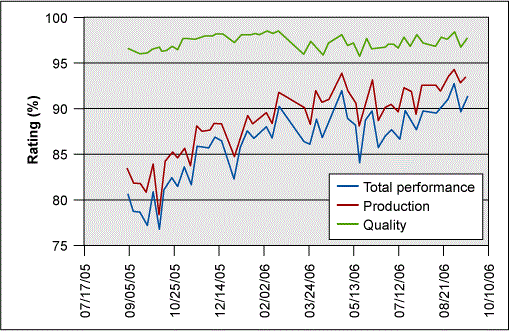
The team developed a performance metric to provide operator accountability. The metric was a product of two factors, each normalized on a 1 to 100 percent scale: “machine up-time factor” and “machine quality factor,” the latter based on the percentage of off-grade bobbins found at final pack-out inspection. Each bobbin contained a label that identified the operator and machine position and that enabled this data to be easily collected. Figure 1 shows the two factors (red and green) and their total performance composite (blue). Using this data, each operator’s performance could be quantified on a weekly basis.

As is seen with many Six Sigma improvement teams that are strongly backed by upper management, improvement came quickly in these weekly ratings. Each week, an operations team met to discuss performance, including the weekly operator performance metrics. Originally, the performance goal was targeted at 80 percent, but in just three months that goal was raised to 86 percent and shortly thereafter to 90 percent. Each week the worst performers were identified and retrained, while the best were recognized with small rewards, such as a dinner. In addition, the top performers (those with total performance rankings greater than 95 percent) could be paired with those needing improvement in consecutive-row assignments. People accountability clearly reduced waste and improved performance.
Accountability of Equipment
A BCF yarn texturing position’s purpose is to draw and crimp the yarn to add strength and bulk while at the same time stabilizing its structure for dyeability. There’s roll heating, steam pressure jets, cooling towers and intricate yarn pathways for hundreds of positions that must be made as identical as possible. Any setup with even a minute difference can be disastrous to a final carpet made weeks later at a customer’s mill. The Six Sigma team introduced positional auditing as a strategy to implement equipment accountability.
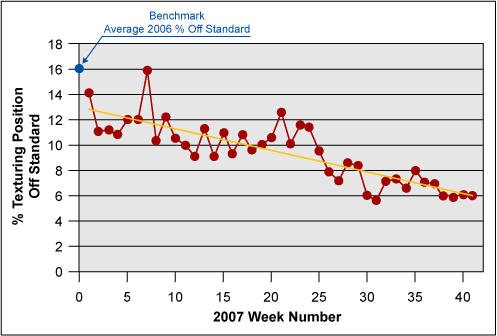
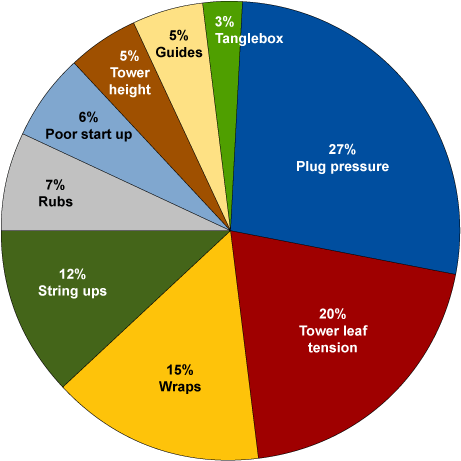
A couple of times each week, a supervisor would walk through the plant and audit each position for problems. Figure 2 tracks the percentage of positions not set properly for one of the nine reasons shown in Figure 3.
The early 2006 benchmark showed that 16 percent of these positions would have one or more problems. Forty weeks later, following introduction of this positional audit strategy, that number had dropped below 6 percent. Figure 3 shows results from one of the last audits taken during this period. It shows how the problems in this 6 percent of the population were distributed (e.g., 27 percent of them exhibited extreme plug pressures) a metric used to quantify bulking jet performance. Clearly, this type of accountability increases operator awareness, altering them about what problems to look for and what metrics are most important.


Maintenance provided another example of equipment accountability. On any given shift, there were two individuals charged with positional maintenance whose job it was to keep the positions operational. When a processing operator experienced a positional problem, he or she would flag it and stop its production. It was then up to the maintenance personnel to get the position back up and running. The team established a positional maintenance accountability strategy by monitoring the mean time required between fixes – by position and by maintenance operator. What they found was astounding.
While two-thirds of these positions would perform for hundreds of days without a problem, on average, positions serviced by maintenance operators would require additional work within 2.5 to 4.5 days (worst to best maintenance operators). Obviously, the maintenance strategy was designed to apply a Band-Aid to the problem rather than a lasting fix. Accountability allowed the team to help operators understand and then improve that strategy.
Accountability of Yarn Characteristics
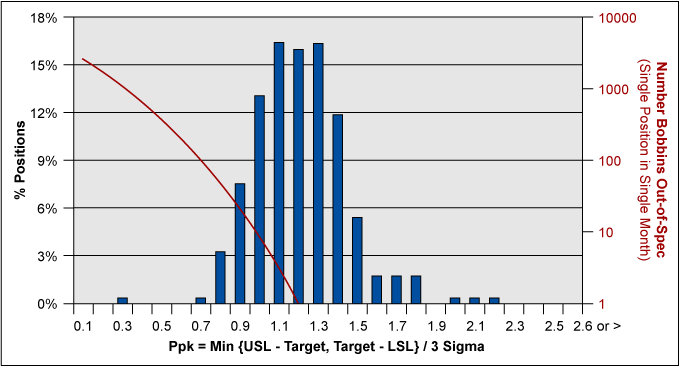
BCF processes are controlled for, among other things, their yarn bulk level. Bulk differences are problems that are most likely to show up later as carpet streaks. Although each position is routinely controlled for bulk through an exponentially weighted moving average (EWMA) strategy, there still could be a wide range of bulk responses within a position over time, as well as between positions. Consequently, the team monitored bulk and bulk variation, and then calculated positional Ppk – process performance – in a 20-shift rolling average.
Figure 4 shows the distribution of positional bulk Ppks for a given product being run on 280 positions. Remember: A Ppk of 1.0 means that at least Six Sigma variations of the population (99.73 percent) could be expected to be found constrained between upper and lower specification levels. Lower Ppk numbers equate to more out-of-spec material being formed by that position. The red line, for example, shows how many textured bobbins could be expected from a position performing at a given Ppk level for one month. The position with a Ppk equal to 0.30 could be expected to produce as many as 1,000 out-of-spec bobbins in a month’s time.

Once this metric became available, a maintenance strategy could be implemented where: 1) daily, the worst-performing positions were identified and improved and 2) the best-performing positions were identified and used as chances to learn more about the characteristics required for top performance.
Team’s Teaching
The team involved in this Six Sigma project learned a valuable lesson: the more data one can gather from a process, the better the chance there is to understand the process and then to improve it. Adding accountability metrics for operators, equipment and product helps to identify improvement opportunities.
Editor’s note: Read another “Team Teachings” article regarding improving process operator competency, here.