Part 1
Looking at the team I saw their eyes were glazing over. I hate that. We were finishing up a workshop in which the team had developed a current state process map of an information technology (IT)-related process. I was walking them through the sticky notes on the banner paper that made up the map – ensuring we got it all and that everyone was on the same page. But as we went from step to step, I saw the thousand-yard stare creeping into some eyes. We were to meet a week later to develop future state – and I realized they’d never remember the current state.
Later that night, as I worked on scribing the sticky notes into an electronic map, I pondered the team’s reaction. Up to this point, the project had been a dream. The company had identified the processes that were causing them pain and had assembled the right team to work the issues. They were the folks who worked the processes, knew them and wanted to fix them. The teams were given time, support and facilitators to lead them. All the pieces were there, yet something was missing.
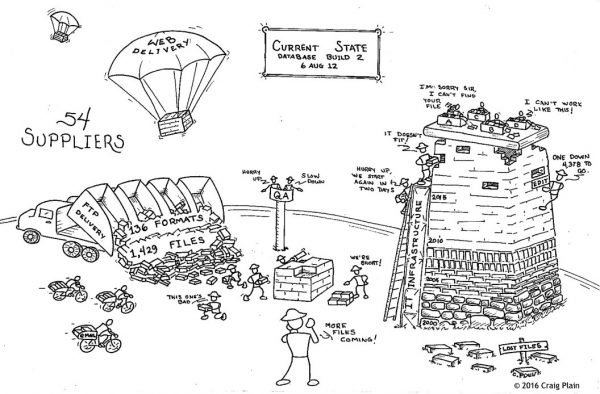
After finishing the process map, I was relaxing with one of Colorado’s many craft brews and absent-mindedly doodling. Looking down I saw I’d sketched a tower, with lots of little workers furiously working to build it. It was from an analogy somebody on the team had used during the event – that they felt like they had to build this “thing” every month at a frantic pace but they never got to complete the work before they had to start again. It was a great analogy – and it led to a great idea.
A week later the team gathered together once again. As they grabbed their coffees, jostled their chairs and settled themselves, I fired up the projector and announced that we’d quickly review the current state map they developed at the last meeting. While there wasn’t any moaning, there wasn’t any cheering either. As I looked over the team I saw some quizzical looks as they looked up at the screen and saw – a cartoon.
“Did we do that?,” somebody asked.
“If we did, I didn’t think we were that talented,” quipped another.
“Yes,” I replied, “This is your current state, just in a little different format.” I then began to take them through the drawing. How the files they used to build their database were delivered en masse (like being dumped from a truck) to coming via email (on the back of a bike messenger). There were workers taking delivery, sorting and building. Foremen were yelling directions (some conflicting) as the “database” tower was constructed. The tower was missing bricks, and the top was precariously tilted and the offices/functions that used the database had their desks on the top and were slanted at angles causing papers to slide off. The team commented how perfectly that captured the current state of how the rush construction affected other departments.
In the background were towers built in previous months. The older ones were crumbling and ramshackle. A voice arose.
“Those towers in the back – what do they represent?”
“Those are the databases from past months, as you described in the last workshop,” I replied.
“No, that’s not right…we don’t build new towers every month. We’re constantly adding to the same tower,” she explained.
I smiled, then frowned, then smiled again. I noticed her reference to “tower” and not “database” so was happy they took to the analogy. But was upset at the fact that we missed the fact the database was added to, not recreated every month. Then happy again by fact that the cartoon helped catch that detail. If I’d walked them through a process map of rectangles, diamonds and ovals, I doubt that we’d have caught that element. I took note of that and a few other minor catches as we ended the review. Later that night, I redrew the cartoon, replacing the towers in the background with a single one. The lone tower had distinctive layers, labelled by year. The older bricks showing signs of crumbling and distress, as the team had mentioned problems with aged data. At the end of the review, I was surprised now engaged the team had gotten using the cartoon as a review tool.
The building analogy became part of the team’s identity. Somebody brought in a toy plastic hard hat similar to the ones I had drawn on the cartoon figures. By the end of the week they all had them. The person who was the team lead for the event became the “foreman.” Somebody suggested packing food into tin buckets and taking lunch on the girders of a nearby construction project, which was immediately voted down by the saner majority. Files were referred to as bricks and “Rapunzel’s Tower” became the ideal future state (one of the team had long hair and it morphed into a joke). A pristine tower, with just a glimpse of long hair flowing down the far side, was drawn to represent the future state.
The team ended up having a very successful project, identifying a long list of improvement projects to be worked. But more than that, they had a lot of fun and bonded in a way I hadn’t seen before. I credit the cartoon. It provided the catalyst to get the team engaged.
During a report out of the project, the team used the cartoons. Another team working in a different area lit up seeing the drawings. Afterwards, their facilitator, a friend of mine asked me a favor.
After drawing a cartoon for him, I drew another for another event, and then another and another. The example above was a blend of several events. I homogenized and pasteurized them to avoid pointing out any specific company, but still allowing me to pick the best examples and most amusing anecdotes. And so I’ve been drawing cartoons of process maps (though some have asked me to label them as “graphic representations”) ever since. I’ve found it a great remedy for glazed-over eyes.
Part 2
As I’ve promoted the idea of graphic representations of process maps, folks eventually began asking questions. Questions about how the cartoons are used, how they’re developed, formatting issues, etc. Here are some of the questions sent to me and my replies.
“Black and white is boring. Why don’t you add some color?”
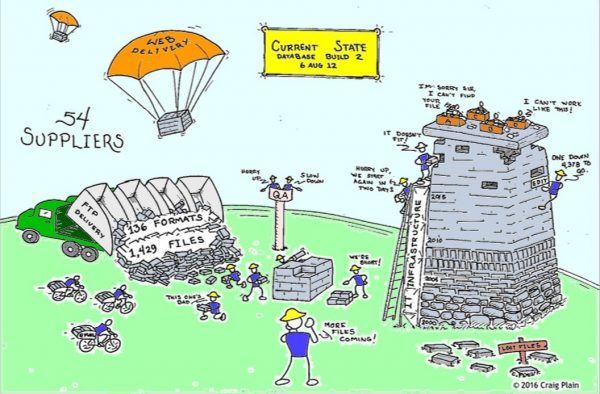
I did a color version. While a bit more eye catching, I feel it makes the drawing busier. The simplicity of black and white is more appealing to me, and easier to walk a team through. There’s also the fact that it’s quicker to whip out a black-and-white graphic.
“Are you saying you replaced value stream maps (or process maps) with a cartoon?”
A cartoon is not a replacement for value stream or process maps in an improvement event. I used the cartoons as a tool to help engage the teams in review and discussion of the process. I’ve found that most engineers and IT professionals tend to be visual learners; they respond to graphics. That’s why process maps tend to resonate so well with them. I merely took that one step further and morphed the map into a cartoon. If the event is using a value stream, we’ll still work to develop a detailed map with the classic symbols and appropriate data. Such information is needed to do full analysis. The cartoon is just a fun tool to help further summarize information and involve the team.
“Can you give more detail as to how the cartoon was used?”
The uses have varied by event, by team and by improvement methodology. I first used the cartoons while working for an organization that had a week-long “Rapid Improvement Event’ approach as their standard. After problem definition, a cross-functional team was assembled to create a current state map, then an ideal state map, which led to the formation of a future state map. The event ended with an action list needed to achieve the future state. I started using cartoons to document current and future states. I tried drawing ideal states but found most involved a magical black box and there wasn’t much value added by creating them. Though there was one memorable event that had an ideal state involving a 5-gallon bucket of guacamole, several solenoids, and a lot of plastic tubing, but we’ll save that for another post.
The cartoons are used primarily at milestone reviews. As mentioned, they’re great for engaging the team. They’re also wonderful for bringing any senior leaders up to speed. Many of the events I’ve been involved with had leadership reviews at mid-point and at the end. Cartoons resonate with those who have not been involved in the event.
An unexpected benefit to the cartoons has been as an advertising tool. Often the teams will take the cartoons and sign them. They get hung in offices and cubicle walls. It becomes advertising for the process improvement program as folks see and ask about the cartoons. In one instance a guy who occupies one of those nice corner offices was in a review with cartoons and was so captivated with them, that he had copies hung in his office.
“How about paint points or opportunities for improvement? How do you show them?”
I try to include pain points in the cartoon, either as an action or as a caption. On their own they may not be readily apparent to somebody not familiar with the process. But as the teams “walk” through the cartoon, we talk about the pain points in detail at that time. In the past I have added pain point labels. (See Figure 3.)

“What does a future state cartoon look like?”
Here’s the future state cartoon as mentioned in Part 1 of this article. The comparison between current state and future state is usually quite dramatic. Future states lack the pain points, so there’s less talk and less action. While the contrast is great to spark interest in moving forward, the simplicity of the future state cartoon can be misleading as it does not do a good job of categorizing all the actions required to get there. I’ve experimented with posting notes on the drawing that specify the actions, but, again, haven’t found much value added by doing that. By the time I have list of action items, the team’s already decided on them, so just highlighting them during the walk through of the cartoon is enough.

“My daughter’s got a 9th birthday party coming up. Are you available to draw caricatures?”
While I’ve been doodling for many years, I’m no professional, and certainly do not have the skills of the artists you see on various boardwalks or amusement parks. So I’d have to decline any birthday party work. But if anyone’s interested in talking about cartoons and process improvement work, I’d love to hear from you.