
A contingency table allows you to visualize the relationship between a categorical X variable and a categorical Y variable. The contingency table is a matrix that allows you to view the frequency of occurrence between the different combinations of your X and Y variables.
Overview: What Is a Contingency Table?
A contingency table, also called a two-way frequency table or crosstab, is a tabular matrix with at least two rows and two columns. It is used in statistics to present categorical data in terms of frequency counts. The observed frequencies are arranged into rows and columns. The intersection of a row and a column is called a cell.
The table below is an example of what a contingency table would look like for two variables (gender and favorite way of eating ice cream) where gender has two levels and favorite way of eating ice cream has 5 levels. Note that the rows and columns have been tabulated along with the total.
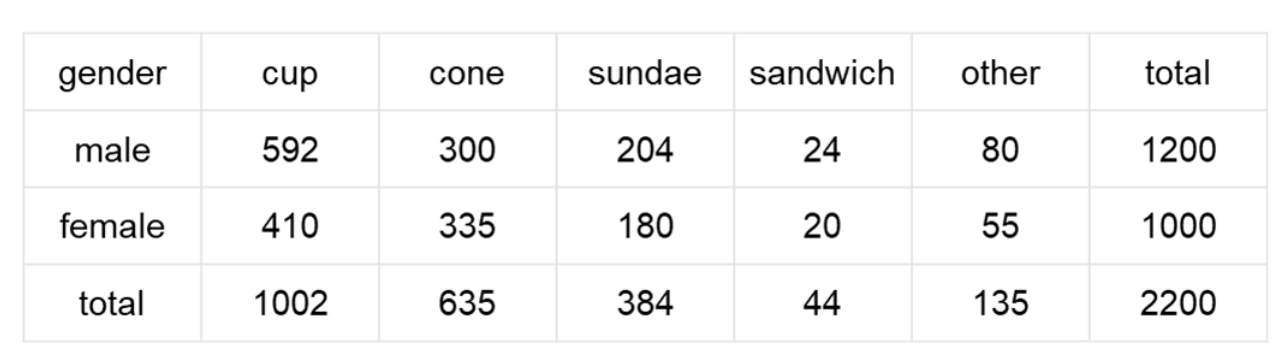
Once in this format, several mathematical calculations can be performed. For example, only 44 out of 2200, or 2% of the people sampled prefer to eat their ice cream in a sandwich. To determine whether there are any statistical differences between gender and preference on how to eat ice cream, you would commonly use a Chi-square test. The null hypothesis (Ho) is that there is no relationship, while the alternative hypothesis (Ha) states there is a relationship.
An Industry Example of a Contingency Table
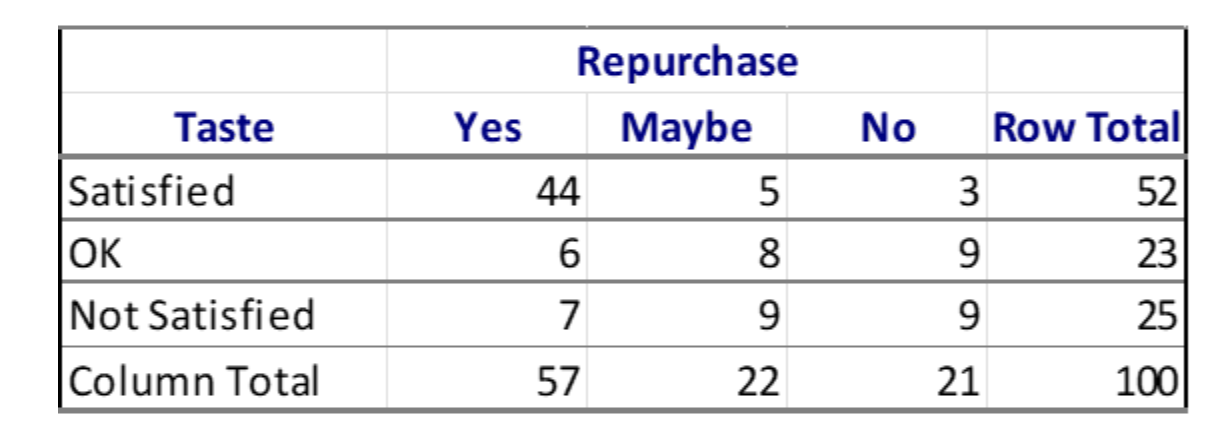
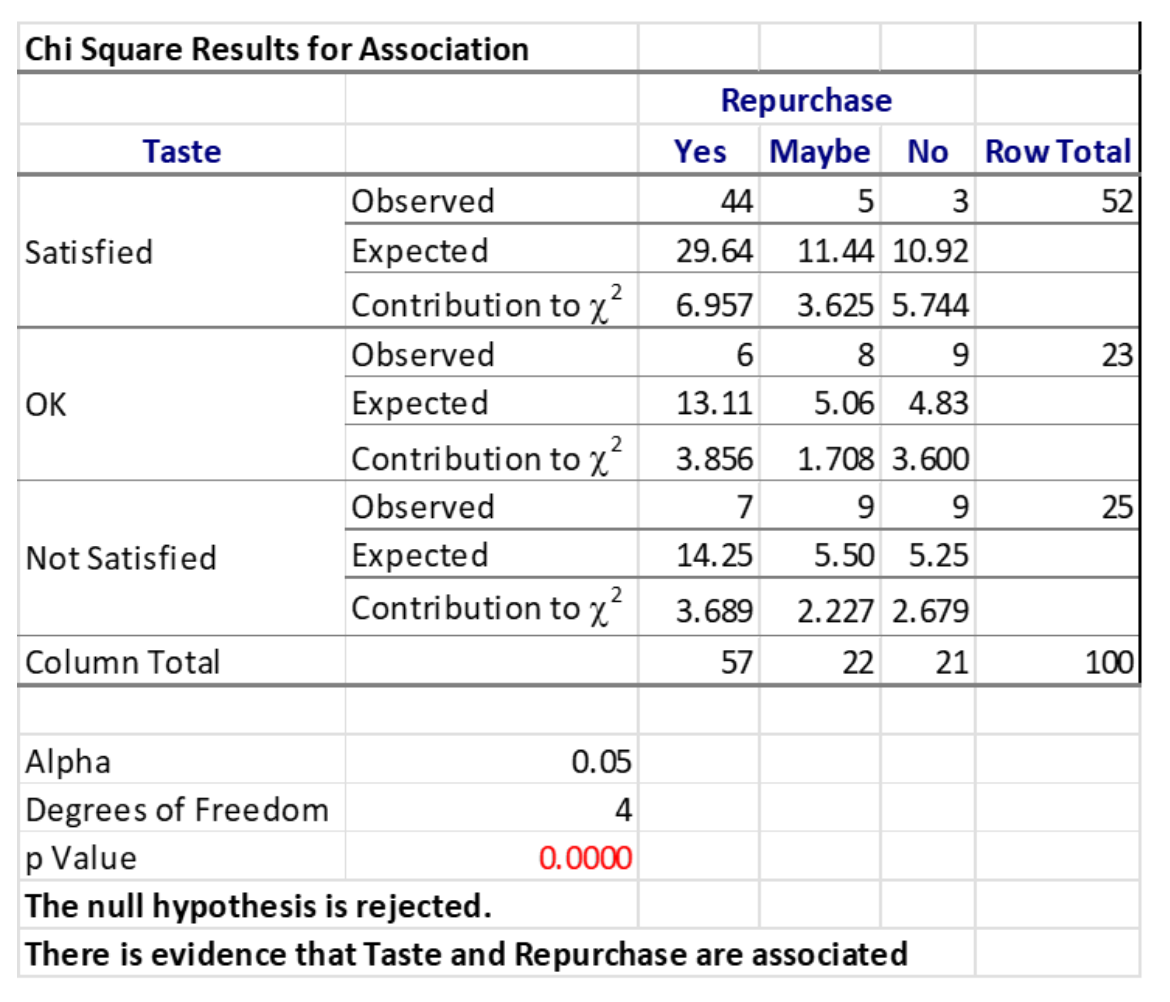
The Vice President of Sales reviewed some data to determine whether the customer’s experience with the company had any relationship with their future buying patterns. A contingency table was created, and a Chi-square test was done to establish a statistical understanding of any relationship. You can see that whether the customer repurchases the product is related to their experience with the product’s taste.
Frequently Asked Questions (FAQ) about a contingency table
Can I have a bigger contingency table than 2×2?
Yes, you can use many different levels or categories for your X and Y variables.
What is the easiest calculation I can do in a contingency table?
The easiest calculation is to sum the columns and rows. From there it is easy to calculate the probabilities or percentages of the cells.
What does using a Chi-square test with my contingency table tell me?
A Chi-square test is used to compare observed results with expected results. The purpose of this test is to determine if a difference between observed data and expected data is due to chance, or if it is due to a statistically significant relationship between the variables you are studying.