
Frequently, you may want to establish whether there is a correlation or relationship between two continuous data variables. If you are interested in estimating the value of your dependent variable (Y) you should understand which of your independent variables (Xs) are correlated with Y. A strong correlation might indicate that a change in the X will result in a change in Y.
Overview: What is the Correlation Coefficient (r)?
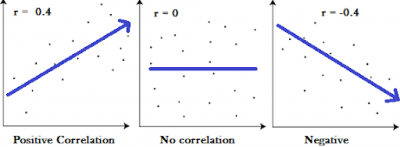
The correlation coefficient, also known as the Pearson’s correlation, is a measure of the strength of a linear association between two continuous variables. The correlation coefficient can range from +1 to -1. A value of 0 indicates there is no correlation between the two variables. A value less than 0 indicates a negative correlation meaning as your X increases, your Y value decreases. A value greater than 0 indicates a positive correlation meaning as your X increases, the value of Y also increases. See the graphs below.
An industry example of correlation coefficient
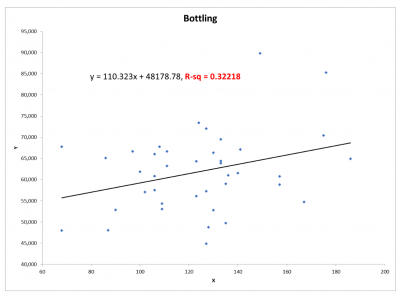
The manufacturing manager of a large bottling plant wanted to determine if there was a correlation between the number of good bottles filled and machine run speed. Intuition told him there should be. His Black Belt (BB) helped him run the data which is shown below. You will note the correlation coefficient or r is .32218. This can be interpreted as 32.22% of the variation in good bottles can be explained by run speed. The question is what accounts for the remaining 67.78% of the variation? You can also see how far the data points are from the line of best fit. While there is correlation, he now needs to explain why the data shows it to be relatively weak.
Frequently Asked Questions (FAQ) about the correlation coefficient
What is the range of values for the correlation coefficient?
Values for the correlation coefficient may range between -1 (perfect negative correlation) to +1 (perfect positive correlation). A value of 0 indicates no correlation.
Does the correlation coefficient measure causation between my X and Y variables?
No. The correlation coefficient shows the strength and direction of the relationship between your X and Y variables. It does not establish causation. You may use Design of Experiments to establish causation.