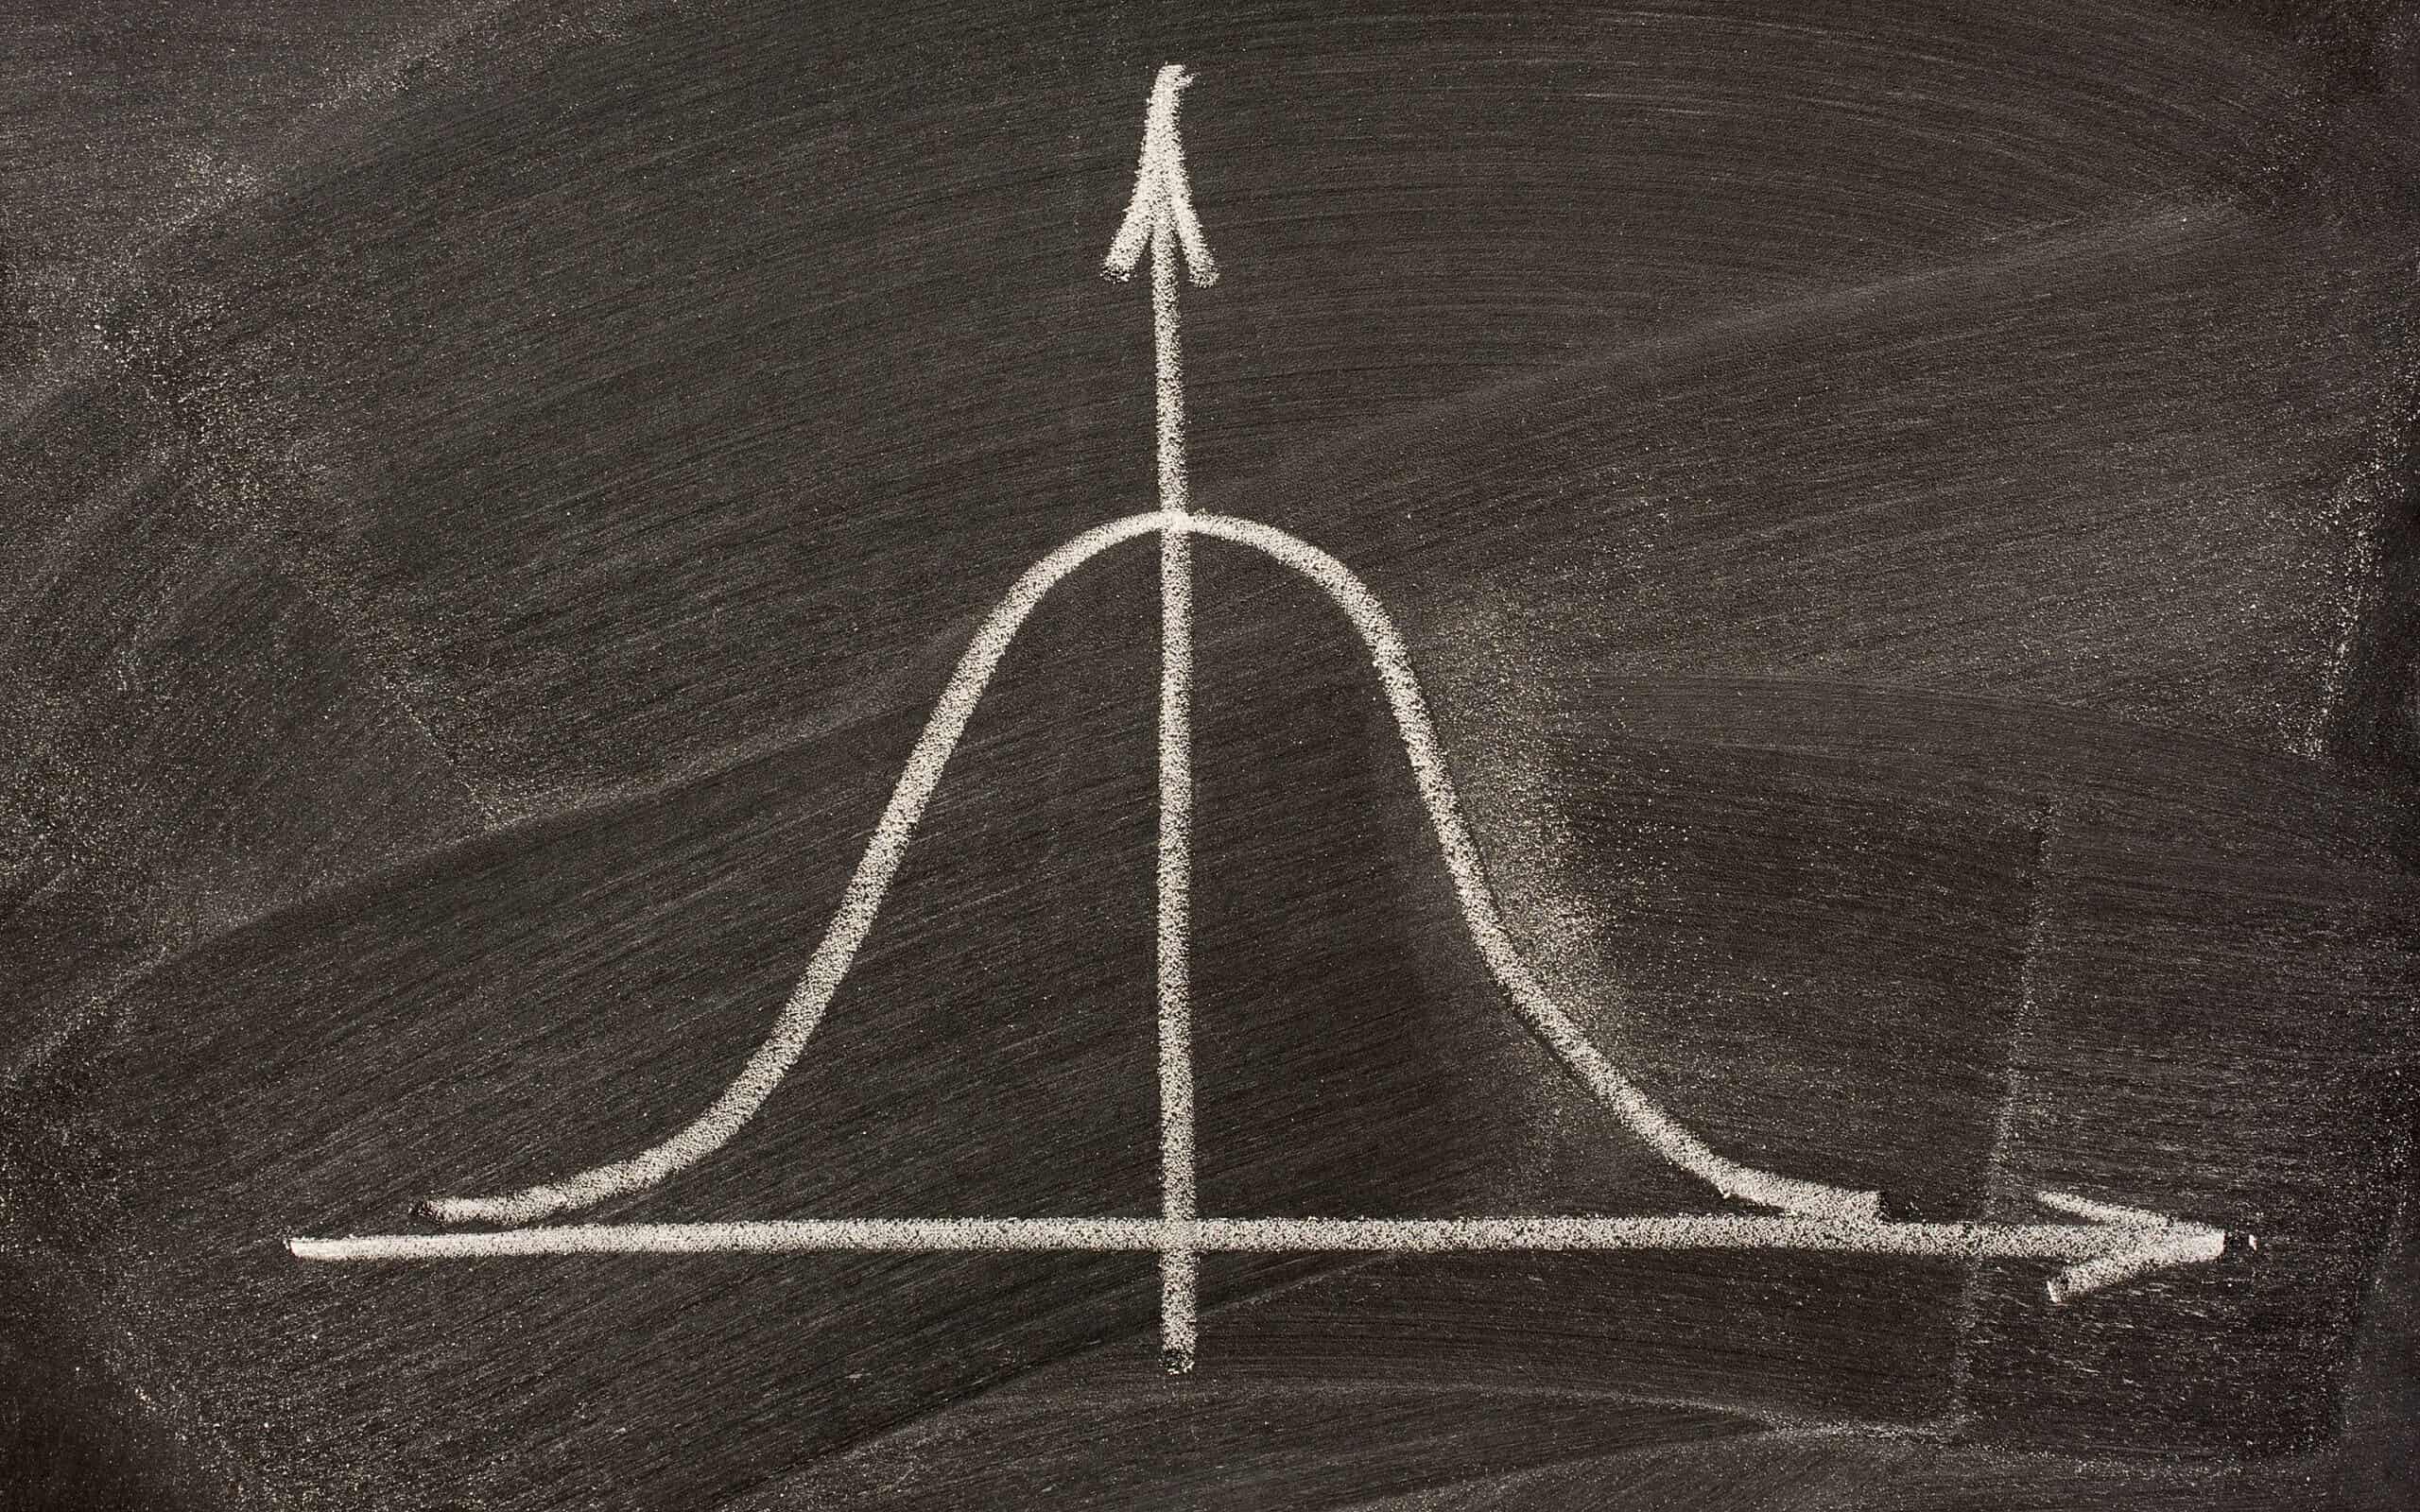
If your data demonstrates skewness, it’s not a good or bad thing. It is the shape of your data. This article will discuss the different types of skewness and what it means for your data.
Overview: What is skewness?
Skewness is a measure of the symmetry of your data distribution. A distribution is symmetric if it looks the same to the left and right of the center point.
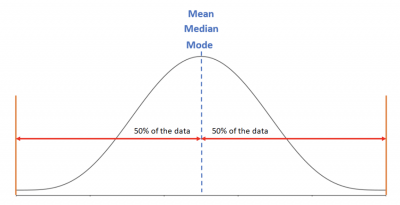
For example, the normal distribution is a symmetrical distribution where the three measures of central tendency (mean, median, and mode) are all the same, and half the data falls left of the center and half to the right. A symmetrical distribution will have a skewness value of zero.
You can see this in the graph below.
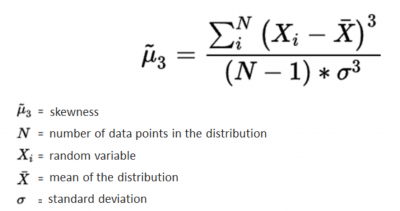
For a single attribute distribution, the formula for skewness, known as the Fisher-Pearson Coefficient, is the third standardized moment around the mean:
Negative or positive values indicate the direction of the tail. Negative, or skewed left, means the left tail is long relative to the right tail and points in the direction of zero and negative.
Positive, or skewed right, means that the right tail is long relative to the left tail and points to higher positive numbers.
Some measurements may have a natural lower bound and will naturally skew right. For example, time can be infinitely long but can’t be less than zero…at least not without a time machine. Outliers can also impact your distribution resulting in skewness.
The relative values of the mean, median, and mode will provide an indication of skewness. In a symmetrical distribution, they will all be equal.
In the graph below, you can see the relative positions of the mean, median, and mode depending on the direction of the skewness. By observing just the descriptive statistic of each, you will be able to visualize the degree and direction of the skewness. This is why it is recommended you don’t rely on the average of your data alone without comparing it to the median and looking for outliers. When combined with the actual value for skewness, you can describe the nature of your distribution.
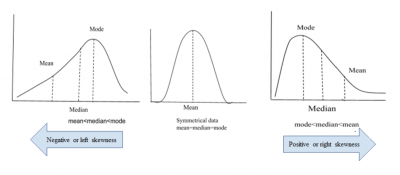
Relative values of central tendency
3 benefits of knowing your skewness
Skewness is not necessarily an anomaly in your data. It may be a function of the nature of the characteristic you are measuring. Here are some benefits for knowing what your skewness means.
1. Existence of outliers
A distribution may be skewed as a result of an outlier. If so, you will want to determine if that outlier is the cause of the skewness. If so, you may actually have a symmetrical distribution and can make the appropriate decision about your data.
2. Easy to compute and visualize
Most computer programs will compute the skewness value. The closer to zero, the more symmetrical your data. Negative or positive values will indicate in what direction you should look for an explanation of your skewness. A histogram will give you a visual picture of the data where any skewness should be easily seen.
3. Provides insight into your data
If skewness is indicated, you should review your data to understand the cause of the skewness. If something unexplained or unexpected occurred, you can take the appropriate actions.
Why is skewness important to understand?
Since your data is a reflection of your process, understanding the reasons for skewness will help explain your process.
Understanding how your data is distributed
Not all distributions should be assumed to be symmetrical. Skewness will help you understand how your data is distributed.
Normal distribution
Not all symmetrical distributions are normally distributed. But, since the normal distribution is an underlying assumption of many statistical tests, you can use your skewness value to understand whether your data is at least symmetrical. If not, your data will not be normally distributed, and you will fail the normality assumption if your test requires adherence to that assumption.
Use for prediction
Many people use the average to predict or make projections. But, if your data is skewed, the average may not represent the true central tendency of the data. You may be better off using the median unless there was a specific cause for the skewness and you took corrective action to revert to a symmetrical distribution.
An industry example of skewness
The facilities manager of an office building was reviewing the maintenance records for the eight elevators and noticed the average downtime for an elevator was 3 hours.
He was quite upset about the inconvenience this could be costing the building’s tenants. He was about to fire the elevator maintenance company when one of his staff suggested he make a histogram of the data and look a little deeper into the data.
This is what the histogram looked like:
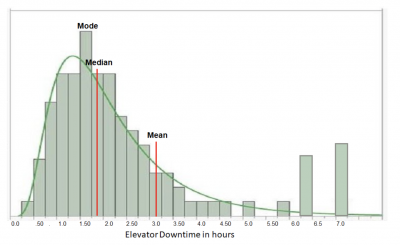
It became obvious the average of 3 hours was not representative of the true process. The mean was skewed right by the number of unusually high downtimes due to the lack of available replacement parts. The median of 1.75 hours was more indicative of the true performance of the elevators.
Action was taken to stock a higher number of the parts that took longer to procure so the longer downtimes could be eliminated.
3 best practices when thinking about skewness
Here are some tips on how to best utilize information about your data and any skewness you may have.
1. Plot your data
Graphical plots like a histogram or dot plot will give you a quick visual of the distribution.
2. Look for special cause
Answer the question of whether the skewness is a natural condition of the data or due to some special cause like outliers or a multi-modal distribution.
3. Don’t use the mean if the distribution is too skewed
The median may be a better measure of central tendency since the mean can be distorted by skewness.
Frequently Asked Questions (FAQ) about skewness
What is skewness a measure of?
Skewness is a measure of the symmetry or asymmetry of your data distribution.
What’s a good value for skewness?
A symmetrical distribution will have the same values for the mean, median, and mode. The value for skewness will be zero.
What do positive and negative skewness mean?
Positive and negative skewness values indicate in which direction the distribution tail points. A negative, or left skewness will have the tail pointing towards zero or negative values of your measurements. A positive, or right skewness will point towards higher positive values.
Skewness doesn’t mean your data is all skewed up
The symmetry of your data distribution is measured by skewness. A perfectly symmetrical distribution will have a skewness value of 0; values of the mean, median, and mode will be the same; and half your data will fall to the left of the center of your distribution and half to the right. Skewness can be a result of a data outlier, or a natural upper or lower bound to your data.
There are two easy ways to quickly determine whether your data is skewed. First, plot the data on a histogram or dot plot. The second way is to compare the values of your mean and median. If they are relatively different, it means your mean has been distorted.
If your mean is higher than your median, you have a positive, or right skewness. If it is less, you have a negative, or left skewness.