
The Therabath paraffin therapy bath (pictured below) is a durable medical device that holds one gallon of molten paraffin wax. Sufferers of osteoarthritis use it for physical therapy. They dip their hands repeatedly in the heated bath, which helps loosen stiff joints. The wax then slowly solidifies as a glove, producing further therapeutic benefits via the heat of fusion. Oils reduce the overall melt point to a comfortable level, facilitate removal of the glove and provide moisturizing for skin.
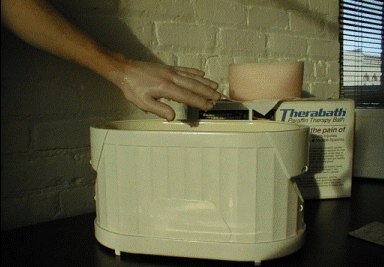
The tank holding the molten wax is made out of stamped steel. It is then powder-coated electrostatically with an epoxy-based paint. The coating must withstand temperatures approaching 130 degrees Fahrenheit and exposure to salt-water that collects from the sweat of the Therabath users.
The units are sold with a life-time guarantee. Very few units get returned, but in those that do, two types of off-grade predominate:
- Blisters that appear spontaneously after some time in use
- Scratches that become noticeably corroded
It’s believed that if adhesion can be maintained at a level above 200, with hardness set at 140, the problems noted above will recede to a level of quality consistent with Six Sigma. (For reasons of propriety, we do not show units of measure of these responses.)
Designing an Experiment that Combines Mixture with Process Variables
Our design of experiments combined variations in mixture components and process factors.1 Table 1 shows the names and ranges of the input variables, as well as their expected variation in terms of standard deviation, which will come into play when calculating POE.
Table 1: Input Variables for Powder-coating Study
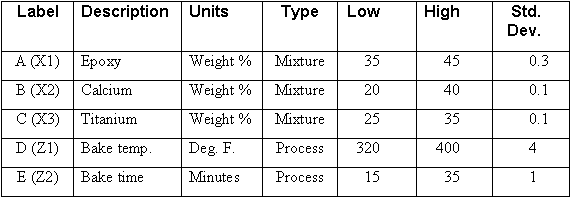
The mixture variables (A, B and C) added to a constant of 90 weight percent of the powder. The other 10 percent was made up of bisphenol A, aluminum oxide and silica, all held in constant proportion. The paint chemists expected the three main powder-coating components to interact in complex ways. To properly model such behavior, we wanted to formulate a sufficient number of unique blends to fit a “special cubic” mixture model:
![]()
The process factors of bake time and temperature (D and E) also were expected to interact with each other and possibly create non-linear responses. For this reason, we decided to collect sufficient data for fitting a “quadratic” process model:
![]()
Models like this are typically used to develop response surface graphs for process optimization.
These two models were crossed to account for possible interactions between mixture and process. For example, the ideal coating formulation may differ depending on the choice of bake time and temperature, which could be a function of the particular type oven available for processing the tanks. The crossed model contains 42 terms (7 from the special cubic mixture model times 6 from the quadratic process model). With the aid of computer software,6 a d-optimal design2 was generated to provide the ideal combinations of variables for fitting response data to the combined mixture-process model. We added 5 extra unique points for estimating lack-of-fit for the model, plus 5 replicates of existing points to estimate pure error. We also incorporated one center point (combination #3 on the list in the appendix), representing the standard operating conditions, for a grand total of 53 combinations.
The results (simulated) of this experiment can be seen in the Appendix. The combinations are organized for easier viewing, with replicate points lumped together. However, experiments like this should always be performed as randomly as possible to offset any lurking variables, such as ambient humidity.
Generating 3D Surfaces to See Impact of Inputs on Responses and POE
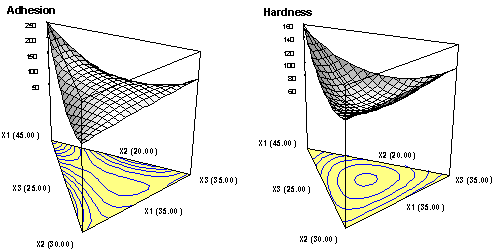
Without computer software to do the number-crunching, it would be incredibly difficult to fit all the coefficients in the mixture-process crossed models. It’s very cumbersome to even sort through all the statistics generated by such software. We advise that you make use of computerized tools for reducing models to their bare essentials. Make sure that the results pass your pre-set thresholds for statistical significance (typically 95 percent confidence) and that you don’t violate any of the standard assumptions for normality (diagnostic plots help you check this). In this case, the statistical analysis produced highly-significant models that met all assumptions. To assess the outcome of an experiment like this, one picture is worth a thousand numbers, so let’s not get bogged down in the statistics. Instead, take a look at the response surfaces for the mixture variables (Figure 6a and 6b) and the process factors (Figure 7a and 7b) for adhesion and hardness.
Figures 6a, 6b: Effect of Powder-coating Components on Adhesion (Left) and Hardness (Right) with Bake Time and Temperature at Mid-levels (Centerpoint)
Figures 7a, 7b: Effect of Process Factors on Adhesion (Left) and Hardness (Right) with the Powder-coating Formulated at Mid-levels (Centroid)
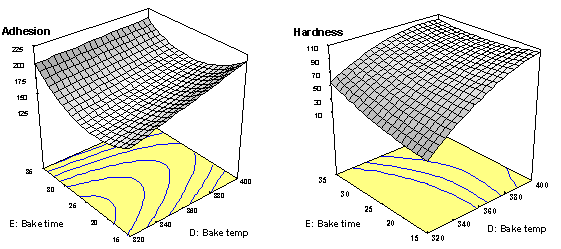
Notice on Figure 7b how the hardness response drops precipitously at the low ends of bake time and temperature. Even assuming you’d accept such a low hardness, this would be a very bad place to set up your process, because results would be very sensitive to variations in the input factors. This can be seen more clearly in the computer-generated graph of POE shown in Figure 8.
Figure 8: Effect of Process Factors on POE of Hardness
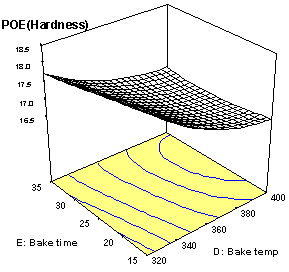
The highest POE (most variation in response) occurs at the low ends of bake time and temperature. However, before worrying about POE, the system must be set up in a way that meets the basic specifications. Then, assuming that there are optional combinations of input variables that accomplish this mission, pick the one that creates the least POE. This requires use of computer software that can do multiple response optimization.
Finding a Setup that Meets All Specifications with Minimum POE
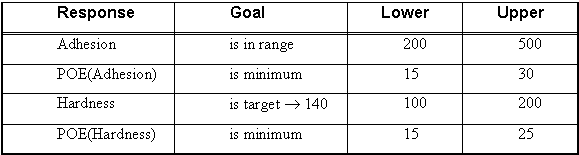
As noted earlier, the goals for the Therabath powder-coating properties are an adhesion of at least 200 and a hardness of 140, achieved on a consistent basis by minimizing POE. Also, to minimize costs of the powder-coat, the more of the cheapest ingredient, calcium, the better. Furthermore, it would be nice for bake time to be minimized, thus increasing throughput. Obviously, to accomplish all this, some tradeoffs must be made. Therefore, it’s necessary to allow for some ranges on all of these goals. Table 2 shows what the Therabath engineers are willing to accept.
Table 2: Goals for Powder-coating Study
The input variables aren’t listed above, but they do get constrained within their previously specified ranges. Never extrapolate outside of your experimental region because the predictive models probably won’t work out there. Stay in bounds or possibly face some dangerous consequences!
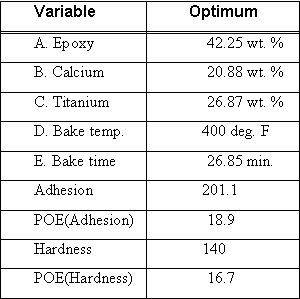
Based on the goals and ranges, the software set up desirability scales on all responses and then searched for a solution that maximized overall desirability. (For an enlightening discussion on how desirability gets calculated and applied, see reference 7, reprints of which can be obtained by contacting the authors.) The optimal combination found by the software can be seen in Table 3.
Table 3: Optimal Combinations for Mixing and Baking Powder-coat
Two “sweet spots” can be seen in the process space (bake temperature versus bake time) by overlaying contour plots for hardness and adhesion, with unacceptable regions shaded out (see Figure 9). (The formulation of the powder-coat is set at the optimal component levels shown above.)
Figure 9: Sweet Spots for Processing Powder-coat Made by Optimal Formulation
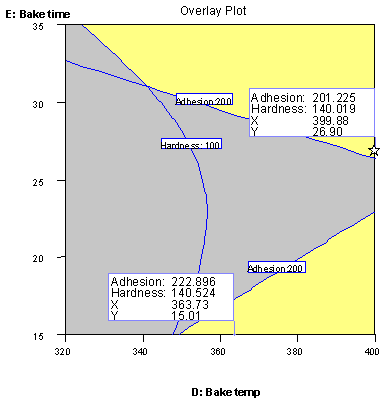
In this view of the multivariable experimental space, adhesion appears to be more of a limiting response than hardness (it forms most of the boundary around the operating windows at top and bottom). It’s tempting to consider reducing the bake time from the recommended level of approximately 26.9 (flag set at starred point in the upper window) to it’s minimum tested value of 15 minutes (see flag in lower window). However, as you can see in Figure 10, the adhesion is the least in the mid-range of bake time (the trough on the response surface).
Figure 10: Response Surface for Adhesion as a Function of Bake Time and Temperature with Optimal Formulation of Powder-coat
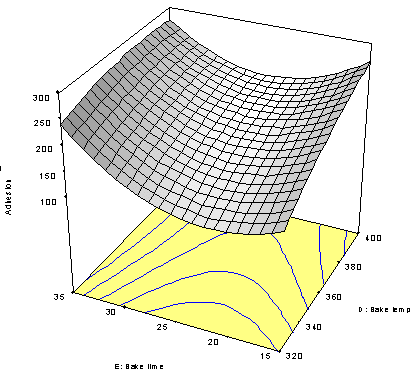
At the values of 15 minutes for bake time at 364 degrees (approximately what’s shown in the lower flag in Figure 9) the POE of adhesion exceeds 23 units of standard deviation, a substantial increase from the 18.9 result reported in Table 3 for the optimum setup. In companies that place an emphasis on Six Sigma goals this may be an unacceptable trade-off. However, if time is of the essence, it’s easy enough to incorporate this in the optimization criteria – simply add a goal to minimize it. That’s what makes the whole DOE procedure outlined in this article so incredibly powerful: It produces statistically-valid predictive models that can be easily manipulated for “what-if” analysis. Then when goals shift, or get weighted differently, it’s just a matter of plug-and-chug and the answer magically appears. To ensure that it’s correct, confirmation runs must be performed. Hopefully, the results will agree well with what’s predicted to happen.
Conclusion
As a result of doing systematic experimentation, using sound statistical principles, the quality of the powder-coating of Therabath tanks can be improved and became more robust to variations in the levels of components and processing factors. With the proper knowledge and software tools, chemists and engineers from any of the process industries (pharmaceutical, food, chemical, etc.) can apply these same methods to their systems and accomplish similar breakthrough improvements.