
Green Belts and Black Belts produce time series plots of the primary Y metric during the measure phase of projects. The time dimension used to plot the data takes one of two forms, start-based or end-based, and the difference between the two can be substantial. Quality professionals risk incorrect conclusions by not understanding and accounting for this difference.
To understand the phenomenon, imagine transactions that take months to complete like selling homes. A sample data set might look like this:
| Real Estate Data Set | |||||
| Address | Appraisal Order Date | Sale Date | Appraised Value | Sale Price | Percent Difference |
| 123 N. St. | 1/1 | 6/1 | 100,000 | 93,000 | -7% |
| 234 S. St. | 2/1 | 5/1 | 100,000 | 95,000 | -5% |
| 345 E. St. | 3/1 | 3/1 | 100,000 | 97,000 | -3% |
| 456 W. St. | 4/1 | 4/1 | 100,000 | 98,000 | -2% |
Note the difference in time series plots given the exact same data, but with different time dimensions. The project champion or process owner might come to a different conclusion depending on which graph he is shown.
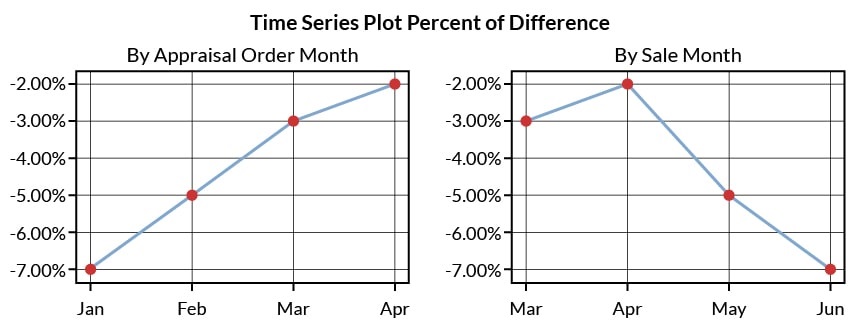
Start-based versus End-based Metrics
Typically, businesses prefer end-based metrics because performance is locked once the transactions are completed. Businesses prefer this because start-based metrics appear to change as older transactions complete their cycles. In the preceding example, the value for 123 North Street (-7 percent) would not be known until June and consequently appears to “change” the plotted value for January after the fact (i.e., going from a null value to -7 percent). Because financial performance is based on the business completed in a prior month or quarter, businesses almost always prefer end-based metrics.
The problem with end-based metrics is that if a project team implements an improvement on April 15th to reduce the percent difference metric it might appear that the project team made things worse.
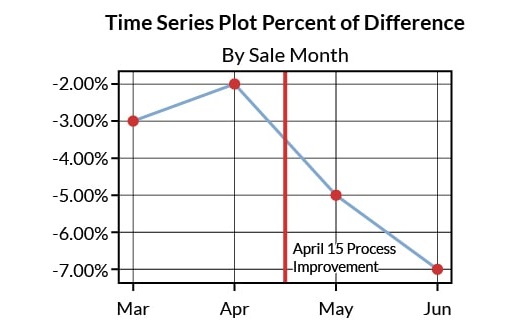
This is not the case since transactions subject to the improvement have not yet registered, but this might not be apparent to the uninformed.
Summary
The solution to measuring the efficacy of the improvement is to compare transactions subject to the improvement against a similar sample of transactions not subject to it. Black Belts should avoid a biased comparison by only drawing baseline samples with aging characteristics similar to improved transactions.