In an inbound contact center environment, delivery of customer service and the end-customer satisfaction index cannot be always accurately determined by service level metrics. A customer service center may be performing at consistent service levels, but the end-customer retention rate and the overall customer satisfaction index may be relatively low.
Direct measurement of customers’ perceptions using questionnaires or focus groups is much more telling than service level metrics. An effective customer questionnaire can help a Six Sigma project team obtain the information on the performance of the center which is often lost in service level metrics, namely whether the center is useful to the customer. Armed with this vital information, a Six Sigma project team will be able to make enhancements to service that are visible and relevant to the customer experience.
Some specific details that can be included in the questionnaire are:
- Overall experience with customer service received
- Type of product or service used
- Features of product or service liked/disliked
- Impact of tangibles (customer service skills, information received, rapport built)
- Type of customer concern
- Number of calls made to resolve the concern
- Reason for multiple calls made
- Follow-up action taken
(Care should be taken to obtain responses specific to the center, especially if there are multiple vendors for the same product or service.)
Trend analysis can be conducted on quantitative question types like multiple choices, rank order or a simple Likert scale where customer satisfaction attributes are assigned to numbers. The rank order and Likert scale surveys enable segmentation of results into satisfaction-level buckets.
Example of a rank order survey:
Question: In thinking about your most recent experience with [name of company], was the quality of customer service you received:
Response: ___ Very Poor ___ Somewhat Unsatisfactory ___ About Average ___ Very Satisfactory ___ Superior
Example of a Likert scale survey:
On a scale of 1 to 5, where 1 = Strongly Disagree, 2 = Somewhat Disagree, 3 = Neither Agree Nor Disagree, 4 = Somewhat Agree and 5 = Strongly Agree. Please circle one number for each statement
Question: In thinking about my most recent experience with [name of company], the quality of customer service received has been excellent.
Response: 1 2 3 4 5
The questionnaire is administered to a focus group of end-customers and the entire population data is considered for analysis. This exercise should be repeated regularly. Care also must be taken to ensure that the sampling protocol is appropriate for the customer population.
At this stage, a trend analysis can be extremely valuable as an early warning indicator of potential problems and issues with customer satisfaction and changes in service standards that impact customers. The standard deviation and variance can be measured with this tool. A dip in the “mean” for a satisfaction question in a particular month should trigger an immediate investigation of the cause. It also can be used to gauge response rates over time (e.g., weekly, monthly and yearly).
Data Analysis and Process Improvement
The process of improving the quality of calls handled by a typical inbound contact center requires a rigorous implementation of the DMAIC (Define, Measure, Analyze, Improve, Control) methodology.
A high-level process map identifies the areas of improvement, key deliverables and the people involved in the supplier-process-customer chain.
|
C |
O |
P |
I |
S |
|
Customer
|
Output
|
Process
|
Input
|
Supplier
|
|
Client |
• Delivery of product |
• Listening skills
|
Correction action and |
• Product training |
|
End-customers |
• Understanding of the problem |
• Evaluations after training on product knowledge and customer service skills |
|
• Product knowledge |
|
Management |
+ Standardization of |
|
+ Quality evaluations |
|
|
Training department |
• Listening skills |
+ Quality evaluations and feedback |
Training |
|
|
Customer care
|
|
Regular monitoring of low performers |
|
Customer care |
|
|
|
|
|
QA |
The baseline of the process should clearly state the present performance level in terms of a process sigma score, and the target below which any performance will be considered as defective. The measurement tool used to evaluate the performance is of paramount importance. This measurement system should be robust enough to measure every aspect of a call and indicate special causes for concern or trends in performance standards, if any. The design of this measurement system should be in consensus with internal and external customers.
The evaluation parameters can be broadly classified under:
- Standard opening and closing
- Soft skills including communication and listening skills, computer skills, etc.
- Content knowledge, follow-up and escalation initiative
- Customer service skills
- English usage
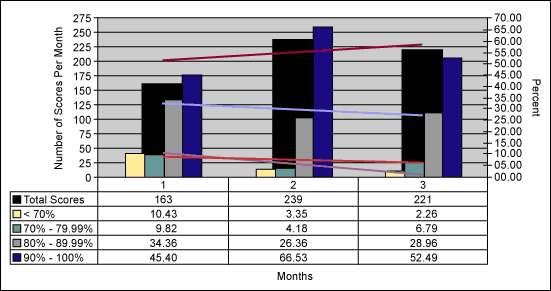
The monitoring and evaluation of calls has to be regular and should be conducted using a standardized set of parameters. These parameters should be customized to detect variance in performance for all types of products and services. Weighted values are assigned to each parameter that will finally amount to a percentage score. The sample size of total scores for analysis depends on the frequency of evaluation during a period of time. The evaluated individual scores can be assigned to performance buckets plotted against the total number of scores. This trend analysis classifies the individuals who need improvement and also the progress in a particular performance segment.

In Figure 1, the dip in the trend in the first two segments (< 70 percent and 70-79.99 percent) has resulted in a considerable incline in performance in the other two segments. The scores in the first two segments are scrutinized and a skill-wise analysis is done on these calls. Special observations are made for trends in poor performance, if any.
The process capability is calculated with respect to the target (Cp) and customer expectations (Cpk). This defines the performance within the customer expectations and the spread of data beyond the desired limits.
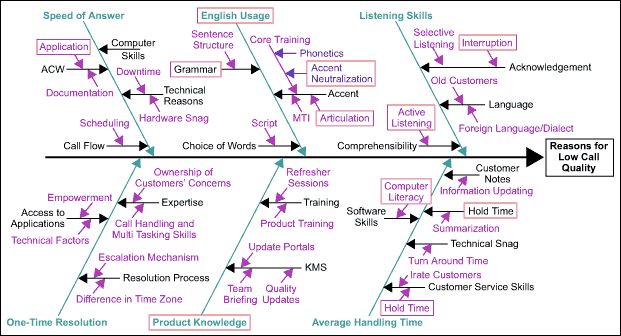
The fishbone diagram (Figure 2) further identifies the factors contributing to the low call quality. The observed factors leading to poor call quality are analysed to identify further potential drivers of each factor.

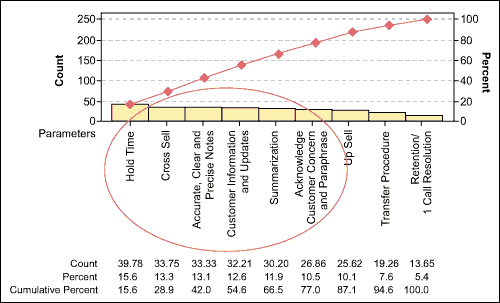
The impact of the major output factors is correlated to the key input factors. The recurring and major contributing factors are further affined to a greater detail. A definite action plan can be drawn up to address these factors. This chain of analysis is completed with the Pareto chart that prioritizes the biggest areas of concern – key process output variables – in order of the impact on the project’s Y.

The critical-to-quality factors are prioritized and the factors responsible for the delivery are identified.
| Critical to Quality | Critical to Delivery |
| Hold time | Technology Content knowledge Soft skills Supervisory help available Call volume |
| Cross-selling techniques | Specialized sales training Nature of call Soft skills and call handling skills Customer service skills |
| Updating of customer information | Applications used Call volume Escalation mechanism Content knowledge Written communication skills |
| Summarization and paraphrasing | Communication skills English usage Active listening Content knowledge |
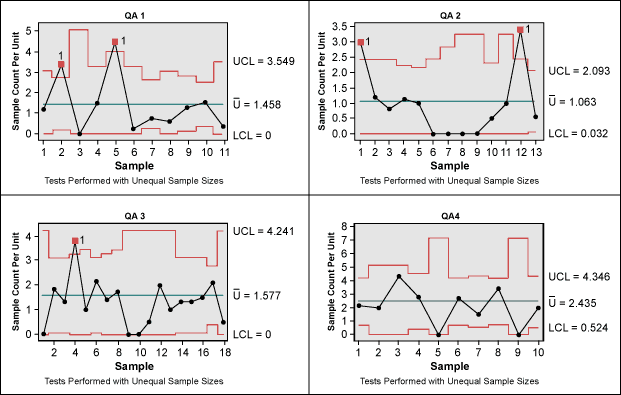
An improvement plan is devised on these critical improvement factors and subsequently a failure modes and effects analysis (FMEA) is conducted to find out the impact of the actions taken. Discrete control charts are implemented to check for repeatability and reproducibility of the evaluators. This need not be done in case of software used for evaluation (e.g., speech and accent evaluation software). Variance or bias in evaluations between different evaluators can be caused due to perception of evaluation parameters, individual competency or even fatigue and shift timings.

Chi square test can be conducted to check for the effect of shift timings on the quality of calls and performance of evaluators, the null hypothesis of which is mostly the case in a realistic scenario. The FMEA is further scrutinized to improve on the action to obtain optimum customer satisfaction. This cycle is repeated after the implementation of the action plan.