A recent study by the National Center for Health Statistics found that, on average, an ambulance in the United States is diverted every minute to another hospital due to emergency room overcrowding. The study underscores the fact that this is a nationwide problem, and that emergency department (ED) diversions often produce a negative chain reaction in the system.
At Providence Alaska Medical Center, change management tools and support from a new emergency department manager helped a Six Sigma team address the hospital’s diversion problem and achieve widespread benefits.
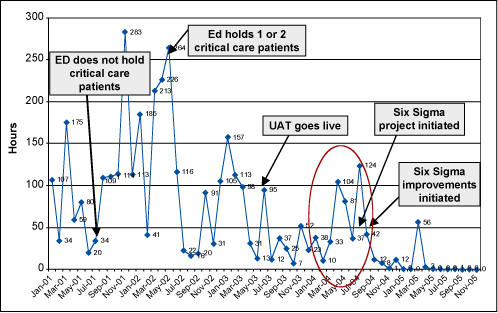
Years ago, the rising number of ambulance diversions at Providence had surfaced as an issue. By 2000, the ambulance divert rate increased from 3 percent to 5 percent, and tripled in the following year to 16 percent.
In 2002, the divert rate peaked at 21 percent and the hospital embarked on an ambitious improvement initiative to address the issue. The results of the initiative led to the implementation of a series of policy and process changes. The hospital also developed a Web-based inpatient capacity tool to assist with patient throughput.
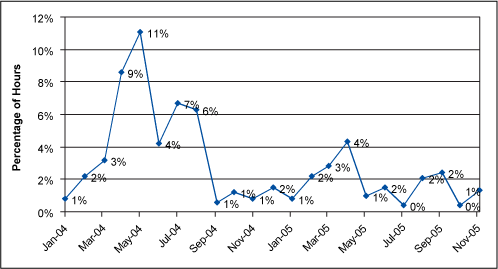
The efforts led to some success – reducing the divert rate to 12 percent in 2003 and to 8 percent in the first three months of 2004. The organization assumed that policy and process changes were effectively decreasing the incidence of diversions.
Renewed Focus
Despite the improvement, considerable variation persisted. In the second quarter of 2004, the diversion rate tripled to 24 percent; in July it peaked, with the ED being on diversion 51 percent of the time.
To analyze and correct this issue, a Six Sigma project was chartered in June 2004. Along with the focus on metrics, a change acceleration process (CAP) and Work-out sessions were introduced to address cultural issues and help facilitate effective decision making based on credible data.
The project focused specifically on reducing diversions as a result of “critical care at capacity” to zero, and reducing diversions as a result of “ED at capacity” to 3.4 percent. The established timeline to achieve the target rates was 1.5 years, or by the end of 2005. The project was actually completed well ahead of schedule in January 2005.
Examining the Data
Department mangers were initially skeptical of the project since diversion was seen as a way to control patient flow on the inpatient floors and in the ED. Physicians had mixed reactions. Some felt the hospital should never divert for any reason, and others felt diversion was a reasonable tool to promote safety, especially during times of high capacity and stress. Change management tools and support from a new emergency department manager helped the team gain consensus and sustain improvement.
Early analysis estimated the average cost for one hour of diversion was $3,400. Realizing this financial impact helped to change the perceptions of senior management and line staff. The data also clearly indicated that the solution must be focused on the critical care unit.
During the initial phases of the project, the Six Sigma team first had to reconcile sources of information. Multiple data sets on the same episodes of diversion led to varying interpretations of the meaning of diversion data.
Before the new standard operating procedures were put in place, there was little rigor around accurate data collection within and among various data sets. Different departments maintained multiple data sets on the same diversion episodes. Definitions and time stamps were not standardized, and access to the various databases was restricted.
The use of CAP and Work-out enabled the team to reach agreement on a common data set to be kept in one location that could be easily accessible by all stakeholders. This transparency helped reduce incorrect interpretation of diversion data.
Clear definitions were established for each type of diversion. Data entry was simplified. Raw data entries were all saved in an electronic record. Time stamps were agreed upon and became part of the standard operating procedure (SOP) for generating the summary diversion sheet.
In addition, the electronic data entry page was designed to reduce entry errors. An SOP was developed so the raw data could be accurately summarized, and the summary sheet was made available on the hospital intranet. The roles of the individuals responsible for data entry and the creation of the diversion summary sheet were clearly defined to reduce variation in the interpretation of the raw data and its translation to the summary sheet.
Data-Driven Solutions and Results
With correct data, the team was able to focus on solutions for the most significant and frequent causes of diversion. Most dramatic was the demonstration that disproved a previously held assumption regarding critical care diversions.
It had appeared that the majority of diversions occurred because no critical care bed was available. Further investigation, however, revealed that the majority of the time “no bed available” was indicated, it was actually because there was no staffed bed, which would signify staffing issues, rather than a physical bed limitation issue.

A summary of the solutions the team identified and implemented included:
- New SOPs were created for the collection of diversion data.
- An electronic data collection tool was developed.
- SOPs were developed for the translation of raw data to a summary sheet.
- Diversion summary data was published on an accessible hospital intranet site.
- Goals and targets for diversion were established.
- Staff was educated on the importance of length of stay as a contributor to staffing needs in the adult
critical care unit. - A high census policy was developed to correct resource issues before a diversion becomes necessary.
- An interventional cardiac recovery unit was developed to reduce burden on the critical care unit.
- Alternatives were established for placement of critical care patients with prolonged length of stays.
- The team recommended proper use of float pool staffing for unexpected vacancies rather than supporting core staffing.

The hospital was able to decrease diversions due to “critical care at capacity” by an average of 26 hours per month. This increased net revenue by $1.04 million on an annualized basis. Keys to success included adherence to a well-defined diversion policy with very clear definitions, and determining the average cost of an hour of diversion. The transparency of data also helped to reduce misinformation and its impact on the organization.
Summary of Key Project Benefits
- Net revenue increase of $1.04 million annually.
- Better patient access through decreased diversions due to “critical care at capacity” by an average of 26 hours per month.
- Significant new opportunities for organizational learning, collaboration and growth.
Organizational Learning and Growth
Among the qualitative results coming from the project, the team benefited from substantial organizational learning through the trials and the successes achieved. This occurred in cycles of reflection that created the platform for the next discovery and learning, and built an awareness of several important considerations:
- Value of accurate data and transparency
- Importance of understanding and communicating the cost of diversions
- Power of uniting around a clear, unified goal
- Impact of a policy change on outcome
- Effect of leadership focus and skills to drive culture change
This project also illustrated that unexpected events are sometimes helpful. The new critical care manager was not a predicted event. However, her determination and commitment drove a culture change within the critical care staff to provide the right care at the right time in the right setting. This change positively impacted diversion rates.
In conjunction with other projects targeting the house-wide admit and discharge process, the ED ambulance diversion effort helped to provide greater access to patient care. It was part of a larger Six Sigma initiative at Providence Alaska that trained six Black Belts and ten Green Belts. The organization has since trained its own Master Black Belts and also is incorporating Lean into its performance improvement toolset.