
Organizations face many problems that impede the rapid development of software systems critical to their operations and growth. The challenge in any software product development lies in minimizing the number of defects. The occurrence of defects is the greatest contributor to significant increases in product costs due to correction and rework time. Most defects are caused by process failures rather than human failures. Identifying and correcting process defects will prevent many product defects from recurring.
This article will present various tools and techniques for use in creating a defect prevention (DP) strategy that, when introduced at all stages of a software life cycle, can reduce the time and resources necessary to develop high-quality systems. Specifically, implementing a model-based strategy to reduce requirement defects, development rework, and manual test development efforts will lead to significant achievements in cost reduction and total productivity.
Defect Prevention
DP is a strategy applied to the software development life cycle that identifies root causes of defects and prevents them from recurring. It is the essence of total quality management (TQM). DP, identified by the Software Engineering Institute as a level 5 Key Process Area (KPA) in the Capability Maturity Model (CMM), involves analyzing defects encountered in the past and specifying checkpoints and actions to prevent the occurrence of similar defects in the future. In general, DP activities are a mechanism for propagating the knowledge of lessons learned between projects.
Mature IT organizations have an established software process to carry out their responsibilities. This process is enhanced when DP methodologies are implemented to improve quality and productivity and reduce development costs. Figure 1 clearly depicts that identifying defects late in the game is costly.
A model for an enhanced software process, including a DP strategy, is presented in Figure 2. Adopting a DP methodology will allow the organization to provide its clients with a product that is “of high quality and bug-free.”
On a macro level, defects can be classified and filtered as depicted in Figure 3.
Features of Defect Prevention
Management must be committed to following a written policy for defect prevention at both the organization and project levels. The policy should contain long-term plans for funding, resources, and the implementation of DP activities across the organization, including within management, to improve software processes and products. Once in place, a review of results provides identification of effective activities and lessons learned to further improve the organization’s success in applying a DP strategy.
To assist in the successful implementation of a DP strategy, members of the software-engineering group and other software-related groups should receive training to perform their DP activities. Training should include software quality assurance, configuration management, and document support, and focus on DP and statistical methods (e.g., cause/effect diagrams and Pareto analysis).
Action and Planning
Creation of an action plan plays a key role in the implementation process. At the beginning of a software task, the members of the team meet to prepare for the task and related DP activities. A kick-off meeting is held to familiarize members of the team with details of the implementation process. Included in the meeting is information related to the software process, standards, procedures, methods, and tools applicable to the task, with an emphasis on recent changes. The inputs required and available for the task, expected outputs, and methods for evaluation of outputs and adherence to the software process. A list of common errors and recommended preventive actions is also introduced. This goes along with team assignments, a task schedule, and project goals.
Periodic reviews are conducted by each of the teams assigned to coordinate DP activities. During the reviews, action items are identified and priorities set based on a causal analysis that determines the:
- Causes of defects
- Implications of not addressing the defects
- Cost to implement process improvements to prevent the defects
- Expected impact on software quality
A Pareto analysis helps set priorities and provides direction for assignment of action items or reassignment to other teams, making changes to activities, and documenting rationale for decisions.
Additional DP activities involve reviewing results of defect prevention experiments and taking actions to incorporate the results of successful experiments into the rest of the project or organization, as appropriate. Examples of defect prevention experiments include using a temporarily modified process or a new tool.
Data Documentation and Measurement
Defect prevention data are documented in a centralized repository and tracked across the DP teams, providing details of the defects and resulting action plan proposals. The status of action items is also documented along with time and cost estimates associated with correcting the defect, and the expected cost of not correcting it. Process improvement proposals, as defined in the project and targeted for the organization’s standard software process, are documented as well. In addition, methods are established to communicate progress to all impacted parties on a regular basis.
The DP teams oversee the work product in a “managed and controlled” environment with changes incorporated in a controlled manner. If a greater degree of regulation is desired, teams can invoke the full discipline of configuration management, as is described in the Software Configuration Management key process area. Measurements are made and used to determine the status of DP activities. Examples include the costs mentioned above; the number of action items proposed, open, and completed; the number of defects injected in each stage; and the overall number of defects.
Verifying Implementation
The organization’s activities for defect prevention are reviewed with senior management periodically to provide awareness of and insight into software process activities at an appropriate level of abstraction and promptly. The time between reviews should meet the needs of the organization and may be lengthy, as long as adequate mechanisms for exception reporting are available. Management reviews include major defect and action categories and the frequency of distribution across those categories; significant actions taken to address major defect categories; and a summary of proposed, open, and completed action items.
In addition, management should review the effectiveness of DP activities, the savings attributable to the activities, and their actual and projected cost. Once the effectiveness of the activities is verified, it is important for the team to ensure that significant efforts and successes in preventing defects are recognized.
Case Study
A case study of a real-time scenario is discussed below, along with statistics derived from the analysis.
The Reference Line
As a first step, a “defect analysis of past projects” was performed to create a reference line for the PIE. As many as 1,336 defects were analyzed from the baseline project (TETRA Released) and two other projects to increase statistical significance. A detailed root cause analysis was performed on all defects, and the Beizer Taxonomy1 was used as the “classification vehicle.” Analysis was done for five development phases: Requirement Specifications, Architectural Design, Detailed Design, Coding, and System Test Case Preparation. Based on this analysis, specific DP solutions were determined for each of the phases.
The Beizer Taxonomy included ten major categories, each of which was divided into three levels, resulting in a four-digit number that specifies unique defects. The ten top-level categories were:
0xxx Planning
1xxx Requirements and Features
2xxx Functionality as Implemented
3xxx Structural Bugs
4xxx Data
5xxx Implementation
6xxx Integration
7xxx Real-Time and Operating System
8xxx Test Definition or Execution Bugs
9xxx Other
The causes of the defects, as determined by the engineers doing the classification, fell into four major categories: communication, education, oversight, and transcription.
In creating the reference line, detailed interviews with 24 software engineers took place. The interviews allowed a full understanding of the reason for each defect, classification of the cause, and an understanding of defect prevention activities. This data mining was performed on all defects, resulting in a series of classification tables and a Pareto analysis of the most common problems. The results of the Pareto analysis according to the Beizer Taxonomy top-level categories are presented below, with the breakdown in descending order.
- Requirements and Features (1xxx) 47.0%
- Functionality as Implemented (2xxx) 13.5%
- Structural Bugs (3xxx) 9.3%
- Implementation (5xxx) 8.3%
- Data (4xxx) 6.9%
- Integration (6xxx) 5.7%
- Real-time Operating System (7xxx) 4.9%
- Test definition or Execution bug (8xxx) 4.3%
Going Deeper
Within each development phase in the baseline project, the defects were further classified based on the Beizer Taxonomy. For example, in the Requirement Specifications phase, the second-level breakdown of the main defects occurred as follows:
- Requirement completeness (13xx) 37.5%
- Requirement presentation (15xx) 34.7%
- Requirement changes (16xx) 11.2%
- Requirement incorrect (11xx) 8.7%
The third-level breakdown of the main requirement completeness defect was:
- Incomplete requirements (131x) 73.4%
- Missing, unspecified requirements (132x) 11.2%
- Overly generalized requirements (134x) 4.6%
The same type of data analysis was performed for each development phase selected for the PIE. The next step was to identify a toolset of phase-specific improvement activities, based on the root cause analysis, that would prevent defects from recurring in the next release. Highest priority was given to the most common defect types. Extensive training and phase kickoff meetings were held to empower the development team to integrate DP activities into the existing process. The development team then applied the improvement activities determined in the analysis phase to the development phases, and ongoing defect recordings and measurements were performed.
The final step was to compare the numbers and types of TETRA Release 2 defects with those of the reference line. The effectiveness of the prevention toolset was measured in the quantity and types of defects found in the second release of the project. The effective prevention actions could then be integrated into the OSSP to improve quality and cycle time for all the projects in MCIL. The impact on the OSSP, including changes to review guidelines and changes to the phase kickoffs, is considered part of the PIE results.
Expected Outcomes
Expected outcomes from the project consisted of a framework for establishing a DP program in a software development environment and a list of improvement actions the TETRA project development group would take to prevent defects, including:
- A method to number the requirements in the SRS document
- A writing strategy procedure to reduce ambiguities in the Requirement Specification phase
- A utility to support/implement the writing strategy
- An improved software requirement specifications (SRS) template
- A formalized context diagram/feature interface chart for the Requirement and Design phases
- Improved review checklists for all development lifecycle phases
- Causal analysis procedures and meeting guidelines
- Improved kickoff meeting templates and guidelines for all phases of the development process
- A testing strategy
An additional expected outcome was the improved quality of the TETRA product, including:
- A decrease in the overall number of defects found in the various development phases
- A shift in the distribution of defects, by phases
- Lower development costs
- Shorter cycle times
Implementation of Improved Actions
At the beginning of the project, kickoff meetings were held for each phase, where the importance of DP and causal analysis was explained and emphasized, and improvement actions for the specific phase were presented and discussed. The actions, as suggested by the PIE team, were generally well received by the TETRA development engineers and managers. Techniques such as improved review checklists were applied immediately after the kickoff at formal peer reviews.
In each progressive phase, engineers became more adept at recording the defects using distributed defect tracking systems and at performing causal analysis. They became more open-minded about reporting and recording their own defects, understanding the importance of a systematic tracking approach to the quality of the product and the process.
Many TETRA engineers expressed satisfaction with the causal analysis process and kickoff meetings, which made them feel better equipped to prevent defects and improved their general attitude towards the software process.
Both technical and business staff considered the PIE a positive process, which provided an advantage in creating better quality products and reducing the cycle time of the development process. As such, the TETRA development group adopted several changes to its processes to accommodate the DP environment.
Internal dissemination outside of the TETRA development group will begin with a presentation of the DP method to the Software Engineering Process Group (SEPG), the owner of MCIL’s OSSP. This group will analyze the results of the PIE project and update the OSSP accordingly. The SEPG will also be responsible for deploying the new process and training the other development groups. This will occur through a series of technical meetings with engineers and managers, who interact with DP activities, the PIE, and the updated OSSP.
Results and Conclusion
As a result of the project, the overall number of defects in TETRA Release 2 has decreased by 60 percent as compared to the number of defects detected in TETRA Release 1 (the reference line project). In part, this is attributed to the fact that Release 2 is a continuation project and not an initial project, as was Release 1, and that later releases usually have fewer defects due to more cohesive teams, greater familiarity with the application domain, experience, and fewer undefined issues. Based on numbers from other MCIL projects, we estimate that half of the defect decrease can be attributed to the implementation of the PIE. A breakdown of defects by phase of origin shows the following results.
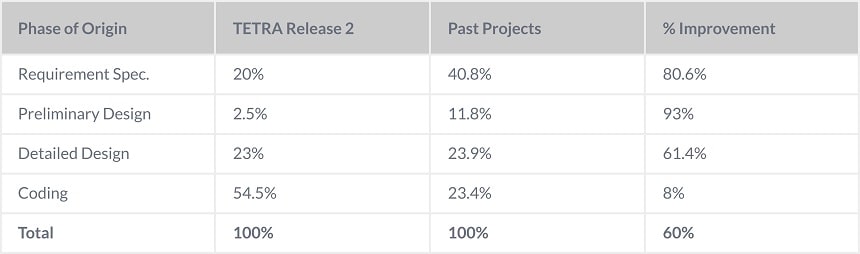
The absolute reduction in defects, which relates to the % Improvement shown in the above table, can be observed in the following figure.
Breaking It Down
The obvious observation is that a higher percentage of the defects migrated to later phases of the development process: from Requirement Specifications, Preliminary Design, and Detailed Design, to Coding. In TETRA Release 1, 76.5 percent of the defects are in the Requirement and Design phases, and only 23.4 percent are in Coding, while in TETRA Release 2, 45.5 percent of the defects are in Requirement and Design, and 54.5 percent are in Coding. This implies that the DP methods employed in the early phases of development were very effective.
The % Improvement column shows the improvement within each development phase with respect to the absolute number of defects. This is a different view of the improvement in the number of defects, partially attributable to the improvement actions.
Another comparison was made in respect to the Cause category with the following results.
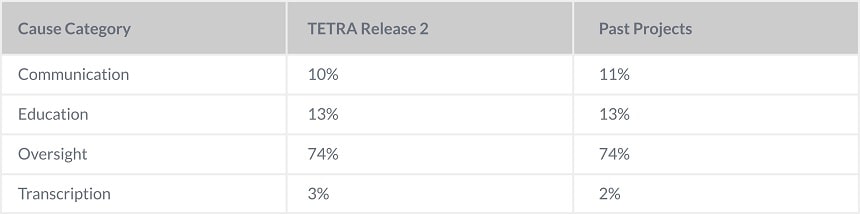
The observation here is that the differences are not significant. The largest bulk of the defects is caused by human errors.
Lessons Learned
There are several key lessons learned from this PIE project.
- Although DP is considered an SEI/CMM Level-5 KPA, we found that a strong Level-3 organization, with a DP infrastructure, can build an effective DP process and obtain excellent results.
- The primary cause of defects, as classified by the development team, is oversight, or human error (almost 75 percent). Our experience shows that the term “oversight” is too broad and should be broken down somewhat, probably based on the Beizer classifications of those defects, which were categorized as “oversight.”
- The timing of the phase kickoff meetings is critical. A phase kickoff should be planned early and performed as close as possible to the beginning of the phase.
- In order for the DP process to be effective, the software teams need in-depth training and initial support in using the taxonomy and performing the root cause analysis.
- A tool to input the classification of defects according to the Beizer Taxonomy is essential. An automatic tool is needed to analyze the defects and to obtain statistical results. The current vehicle used for input of cause analysis and defect classification is deficient. A better interface is needed, as well as a mechanism for adding new categories to the Beizer Taxonomy. Standardized statistical analysis reports are needed for use by all projects for ongoing DP and process improvement.
Acknowledgements
Sincere thanks to my entire team for their continuous support in transferring their knowledge and time in making this happen.
References
1. R.G. Mays, C.L. Jones, G.J. Holloway, D.P. Studinski, “Experiences with Defect Prevention,” IBM Systems Journal, Vol 29, No. 1, 1990.
2. Humphrey, Watts S. Managing the Software Process, Chapter 17 – Defect Prevention, ISBN-0-201-18095-2.
3. Beizer, Boris. Software Testing Techniques, Second edition, 1990, ISBN-0-442-20672-0.