Lack of data may be the most frequently communicated barrier to identification and selection of projects in the IT domain. Fortunately, most organizations have a tremendous untapped resource that is easily accessible – their help desks or support centers. Help desks generally are good at solving problems or determining where more difficult problems should be addressed but they often miss their role in the bigger picture – working to put themselves out of business. Help desks typically fail to provide information that would lead to improvement opportunities for both the IT function and their client users within the business. The good news is that much of the data necessary to perform this function actually is collected and could be used if some effort were made to extract it and convert it into meaningful information.
Help from Centralize Support
Sometime in their development, large IT organizations make the well-conceived decision to centralize support for applications, networks and hardware into a common location, staff it with capable technicians, and call it the help desk. Clearly this is a good decision because decentralized support simply would not be practical. Unless users knew for sure the exact nature of their problem, they would not know whom to call for help?
Furthermore, how could the developers and hardware/network administrators that create and manage the IT infrastructure be expected to complete projects if they also had to provide support for the systems they deliver to the business? This point, however, brings up an important issue. If the key players in the IT infrastructure (applications and hardware development, configuration and management) are shielded by the help desk from the problems encountered by users, how can they know and be motivated to address those problems.
The idea of centralized support, or a help desk, is an excellent notion providing many economies of scale. The usual help desk metrics reflect this contribution. Common measures such as number of calls handled in a given time period or average time to open and close (resolve) problem tickets are helpful in that they reflect the organization’s ability to fix problems. But it must be remembered that support functions are fundamentally non-value-added. And while it is nice to make them more efficient, the objective really should be to eliminate the problems that they handle in the first place. This is where help desks need to use their role as a central repository of information to help the rest of the organization continuously improve.
When a call arrives at the help desk, a technician usually opens an electronic problem ticket and notes such information as the symptom; when the problem occurred; how many users are affected (perhaps translating to a severity code); whether the problem is related to applications, hardware or network issues; and how the problem was resolved. This resident data is valuable and can provide some useful information on performance of the IT function when accumulated and analyzed over time – say, monthly. For example, with just this basic information, a company can get a view of the most severe events and how long they took to resolve, or the most frequent symptoms encountered, their severity, and to which disciplines (applications, hardware, networks) they were related.
Problem Management Database
This information is necessary, but for the purpose of continual improvement, certainly not sufficient. In order to use the data effectively for solving and preventing original problems, a key concept must be understood – the central support function is never the source of the original problem. While a help desk may solve the same problem over and over or its solution may create more problems, the original problem always traces back to failure in one of the core IT processes – applications, hardware, networks, configuration or management. So in addition to capturing the basic information above, a problem management database should be created to enable the organization to identify repetitive issues for the same problem, and the IT process that was the source of a given problem. While addressing problems from both points of view is important, reducing repetitive solutions for the same problems tends to have the most immediate and measurable impact for the organization, both in terms of user impact and in terms of reducing the queue (and consequently the cycle time) of problem tickets for the support function.
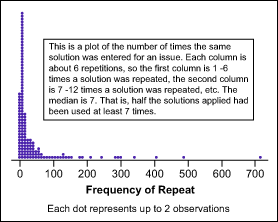
In reducing the number of repetitive problem tickets, the primary challenge is to determine if a given problem by a given caller is a first-time event or if it has occurred before, and if so, whether or not an attempt been made to resolve it. Capturing this information should be fairly easy. A support technician could either directly question the caller or query the user’s problem ticket history. In addition, using the problem ticket database to determine repetitive solutions for the same symptoms in common disciplines often reveals practical information related to the same problems occurring for different users. Figure 1 shows a repetitive problem analysis of a problem-resolution database.

The data in Figure 1 is fairly typical for centralized support functions. A simple frequency graph like this can be valuable, both in terms of the obvious results and in terms of the questions it can prompt. For example, it is easy to see that half of the solutions were repeated more than seven times, and several were repeated more than 100 times. Further investigation of this data set revealed that about 25 percent of all solutions were applied to 85 percent of all issues, and that a mere 30 different solutions were applied to more than 5,500 reported problems. This data enabled the organization to recognize the order-of-magnitude impact that can result from a diligent focus on minimizing repetitive solutions. The organization in this particular example did little more than execute a disciplined process to monitor and respond appropriately to repetitive issues.
The result was a decrease in incoming calls to the help desk from 10,000 per month to less than 3,000. That resulted in an initial staff reduction of 50 percent and a decrease in time required to resolve issues of greater complexity and severity. The point, however is not the specific impact derived, but rather that this data is typical and that analysis of repetitive issues can be fruitful.
Tracing Problems to Their Source
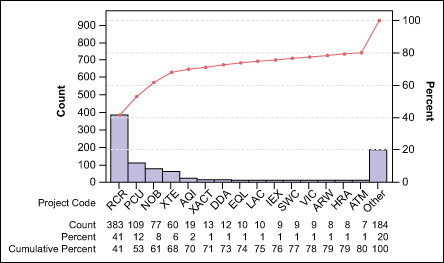
While the impact of addressing repeat issues is often significant, quick and readily measured, the impact of tracing original causes back to their source IT processes can be potentially more significant, though less readily quantified. First, it is necessary to recognize that every IT discipline (applications, hardware, networks) is a collection of processes which fall into the general sequence of determining requirements, designing, building, testing and releasing. Then the problem ticket repository can be used to analyze which project, application, hardware component or network system is the source of a number of problems. Using the defined processes of each discipline, this information will enable an organization to determine which general process or portion of a process is most frequently the source of issues in the problem resolution repository. This amounts to tracing post release errors back to a given project and, even better, to a specific phase of a development or implementation life cycle. Figure 2 shows how the defects from six months of history for one problem ticket database related to the various applications.

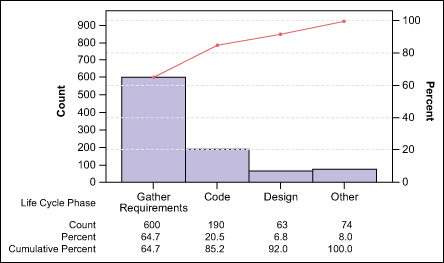
It can be noted in this case that the application “RCR” contributed 41 percent of all the application-related defects observed in the six-month period. One could argue that if RCR is a particularly large or complex project, then naturally, the defect rate could be expected to be high. Of course, the users may say that they do not care how large or complex the project is, they just want it to work right the first time. The business impact still dictates that some attention be focused on the nature of RCR in order to minimize its overall negative impact. The organization could stop here and decide to focus on RCR as a primary opportunity for reducing observed problems. However, in Figure 3another slice of the same data reveals a more systemic issue across all applications.

Here is a different view which provides the data necessary to actually fix a process. That is, “Gather Requirements” contributes almost 65 percent of all the post-release defects charted. This is important because further analysis of the RCR application may have revealed a similar pattern, but the exclusive focus on a given project would have been too narrow, since fixing the RCR application alone would have done little to prevent future problems. On the other hand, by using the data to reveal processes as opposed to projects, the organization now has the direction necessary to focus on the systemic problem of defects in the requirements – gathering process of all projects. This is a critical distinction since many IT projects fall into two primary components – fixing the products of broken systems and fixing the processes that caused the systems to break in the first place. (This is especially true in projects that rationalize excess server capacity. One part of the project should be to optimize the current server capacity; another part should implement a process that prevents the current situation from recurring.)
Conclusion: Valuable Data from Help Desk
Some organizations capture meaningful data on the defects inserted and detected during the life cycle of a given project prior to release. Many do not. Whether or not an organization has this sort of measurement system maturity, there is great value to be obtained from capturing post-release data in the problem resolution repository maintained by the help desk. In this way a non-value-added function like a help desk can at least enable the rest of the IT organization to maximize the value it delivers to the business.