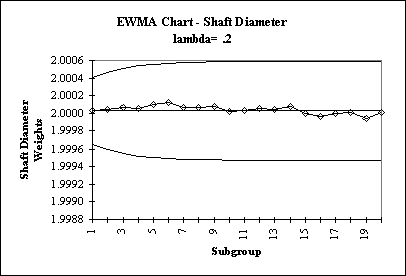
An EWMA (Exponentially Weighted Moving Average) Chart is used when it is desirable to detect out-of-control situations very quickly. EWMA charts have a built in mechanism for incorporating information from all previous subgroups, weighting the information from the closest subgroup with a higher weight. Thus, the control/out-of-control decision is made with information from previous subgroups as well as the current subgroup. The chief advantage of EWMA charts is that they detect out-of-control conditions more quickly than XBAR charts and that this detection can be done by using only one rule…being within or outside the 3-sigma limits. The chief disadvantage is the EWMA chart is that it is more difficult to construct. When the subgroup size is n>1, the EWMA chart is an alternative to an XBAR chart; when the subgroup size is n=1, the EWMA chart is an alternative to the Individuals Chart.
Steps in Constructing EWMA Charts
- Estimate the process standard deviation, sigma, using RBAR/d(2) or SBAR/c(4) if n1 or by using MRBAR/1.128 if n=1.
- Determine a weighting constant, lambda, that weights past and current information. If, for example, lambda=.3, 70% of the weight will be given to past information and 30% to current information. Typically a lambda between .1 and .3 provides a reasonable balance between past and current information and .2 is very common in actual practice.
- Determine the points on the EWMA chart denoted by xhat(1), xhat(2),…,xhat(k)k and computed by using the equation xhat(i)=lambda*xhat(i)+(1-lambda)*xhat(i-1). This recursive formula begins by using as its initial value xhat(0)= XDBLBAR.
- The control limits are not straight lines in the early stages of the chart. The UCL increases and then stabilizes a fixed distance above the centerline while the LCL decreases and then stabilizes a fixed distance below the centerline.
- Plot the centerline, XDBLBAR, the LCL and UCL, and the process measurements XHAT(i).
- Interpret the data. The chart is out of control only if a point is outside the +/- sigma limits.

Example:
The following data consists of 20 sets of three measurements of the diameter of an engine shaft. Lambda has been chosen as .2.
Data and Preliminary Computations:
								lambda
n	meas#1	meas#2	meas#3		Range	XBAR	XHAT	0.2
0							2.0000
1	2.0000	1.9998	2.0002		0.0004	2.0000	2.0000
2	1.9998	2.0003	2.0002		0.0005	2.0001	2.0000
3	1.9998	2.0001	2.0005		0.0007	2.0001	2.0001
4	1.9997	2.0000	2.0004		0.0007	2.0000	2.0001
5	2.0003	2.0003	2.0002		0.0001	2.0003	2.0001
6	2.0004	2.0003	2.0000		0.0004	2.0002	2.0001
7	1.9998	1.9998	1.9998		0.0000	1.9998	2.0001
8	2.0000	2.0001	2.0001		0.0001	2.0001	2.0001
9	2.0005	2.0000	1.9999		0.0006	2.0001	2.0001
10	1.9995	1.9998	2.0001		0.0006	1.9998	2.0000
11	2.0002	1.9999	2.0001		0.0003	2.0001	2.0000
12	2.0002	1.9998	2.0005		0.0007	2.0002	2.0001
13	2.0000	2.0001	1.9998		0.0003	2.0000	2.0000
14	2.0000	2.0002	2.0004		0.0004	2.0002	2.0001
15	1.9994	2.0001	1.9996		0.0007	1.9997	2.0000
16	1.9999	2.0003	1.9993		0.0010	1.9998	2.0000
17	2.0002	1.9998	2.0004		0.0006	2.0001	2.0000
18	2.0000	2.0001	2.0001		0.0001	2.0001	2.0000
19	1.9997	1.9994	1.9998		0.0004	1.9996	1.9999
20	2.0003	2.0007	1.9999		0.0008	2.0003	2.0000

ESTIMATE PROCESS STD DEVIATION:
RBAR  =	0.0005
SIGMA =	RBAR/d(2) =.0005/1.693 =0.000721501

EWMA CHART LIMITS:
XDBLBAR  =	2.0000
UCL=XHAT(0)+((3*SIGMA)/SQRT(n))*SQRT((lambda/(1-lambda))(1-(1-lambda)^(2*i)))
LCL=XHAT(0)-((3*SIGMA)/SQRT(n))*SQRT((lambda/(1-lambda))(1-(1-lambda)^(2*i)))

Control Chart Computations:

Subgrp	CL	LCL		UCL		XHAT
1	2.0000	2.000406569	1.999656764	2.0000
2	2.0000	2.00046109	1.999602243	2.0000
3	2.0000	2.00051173	1.999551604	2.0001
4	2.0000	2.000541506	1.999521827	2.0001
5	2.0000	2.000559683	1.999503651	2.0001
6	2.0000	2.000570994	1.999492339	2.0001
7	2.0000	2.000578111	1.999485223	2.0001
8	2.0000	2.000582617	1.999480716	2.0001
9	2.0000	2.000585482	1.999477851	2.0001
10	2.0000	2.000587308	1.999476026	2.0000
11	2.0000	2.000588473	1.99947486	2.0000
12	2.0000	2.000589218	1.999474116	2.0001
13	2.0000	2.000589694	1.99947364	2.0000
14	2.0000	2.000589998	1.999473335	2.0001
15	2.0000	2.000590193	1.999473141	2.0000
16	2.0000	2.000590317	1.999473016	2.0000
17	2.0000	2.000590397	1.999472936	2.0000
18	2.0000	2.000590448	1.999472885	2.0000
19	2.0000	2.000590481	1.999472853	1.9999
20	2.0000	2.000590502	1.999472832	2.0000
EWMA – Chart:
