
Voice of the customer (VOC) is a central concept within the Six Sigma methodology. Process performance can only be measured if an organization is aware of the critical customer requirements. But customer preferences are often unbalanced (everything is important), vague and unstable. With the help of conjoint analysis, it is possible to derive individual customer preference profiles that are balanced and well-defined. On top of that, individual customer profiles can be clustered into aggregate profiles that reveal the preferences of groups that are latent within the customer base. In this way, an organization can assess the success or failure chances of future services and products.
An Overview of Conjoint Analysis
Conjoint analysis starts with the notion that a product or service is a bundle of several attributes. Customers evaluate each attribute separately and, depending on the satisfaction related to each attribute and the relative weight of the attributes, assign value to the product. For a VOC analysis, it is important to know what features are important for the product evaluation of the customer and how these features should be designed in order to attain an optimum level of satisfaction.

This is a technique that has been widely applied in marketing studies. Before a new product launch, several product layouts are tested by a consumer panel so that the “satisfiers” are identified and the levels that optimize customer satisfaction for these satisfiers are selected. For example, in the development of a new car, design attributes are evaluated against horsepower and price so that the importance of the design attributes can be measured against price considerations. The marketing manager learns whether the customer is willing to pay a premium for a fancy design.
This methodology has much in common with Six Sigma’s Define phase in which it is critical to get an understanding of VOC.
Illustrating the application of conjoint analysis to discover the voice of the customer will help clarify its use. Especially, the strength of the second stated benefit – the aggregation of individual preference profiles.
Ranking the Vignettes
The planning of a conjoint analysis is, in fact, the planning of an experiment. Since Design of Experiments is a cornerstone technique within Six Sigma (especially in the Analyze phase), it is relatively straightforward to add conjoint analysis to the Six Sigma toolbox.
First, the relevant product attributes and their levels need to be defined. Subsequently, the experiment needs to be specified in terms of a full factorial factor matrix or a fractional factorial factor matrix. Since a relatively low resolution is sufficient in most cases (estimation of main effects and some second order effects), a fractional factor matrix is the most efficient design. Such a design is derived with the help of standard tables (e.g., Taguchi tables) or statistical software.

For a conjoint analysis, the rows of an experimental design are printed on small cards, so-called “vignettes.”
| Table 1: Car Example | |
| Vignette No. 1 | |
| Layout | Plain |
| Horsepower | High |
| Price | High |
Each member of the test panel receives a deck of cards that contains all vignettes of the experimental design. They are asked to rank the cards in order of their preference. After each member of the test panel has ranked the vignettes, the rankings are transferred to a form and then entered into a database for analysis.
Now the necessity for working with a fractional factor matrix becomes clear. It is impossible for a test panel to rank more than 20 vignettes. It also should be noted that inherent in the ranking of the vignettes is the need to appraise one attribute against another. In the case illustrated in Table 1, the members of the test panel are forced to assess the benefit of high horsepower against the disadvantage of a high price. It is only through this kind of appraisal that the relative importance of each factor can be estimated. The fact that a customer appreciates high horsepower for a low price is not very informative. But it is interesting to know whether customers are willing to pay a premium for high horsepower. In this way, the VOC appears by forcing the test panel to balance benefits (high horsepower, low price) against each other.

The rankings are analyzed with the help of an appropriate dependency model (an enhanced analysis of variance). For each member of the test panel, an individual preference profile is built containing the relative importance of each attribute and the preferred levels within each attribute. However, the strength of conjoint analysis is the capability to generate aggregate preference profiles.
How these aggregate preference profiles are generated is illustrated by a hospital case study.
Case Study: Physicians and Hospital Design Requirements
In 1998, the attitude of hospital staff regarding “office innovation” was investigated in a large academic hospital with the help of conjoint analysis. A new hospital was being built and the physicians had been given the opportunity to express their preferences regarding the layout of the staff area. In particular, they were given the option of either adhering to small workspaces of their own or sharing larger workspaces.
The vignettes were supplied to representatives of four departments – genetics, gynecology, pediatrics and clinical psychology. The factors and levels on the vignettes were:
- Size of Workspaces
- 1. 5 square meters
- 2. 10 square meters
- 3. 15 square meters
- Archiving of Medical Research
- 1. In staff rooms
- 2. In a departmental library
- 3. In a central library
- Workspace Concept
- 1. Ownership of the workspace
- 2. Activity-based workspaces
- 3. Shared workspaces
(e.g., 6 physicians share 3 workspaces)
- Use of Workspaces
- 1. First-come, first-serve
- 2. According to a reservation system
- Number of Workspaces Per Room
- 1
- 2
- 3 or more
The fractional factor matrix for the estimation of main effects contains only 18 selections. These were printed on sets of 18 vignettes cards.
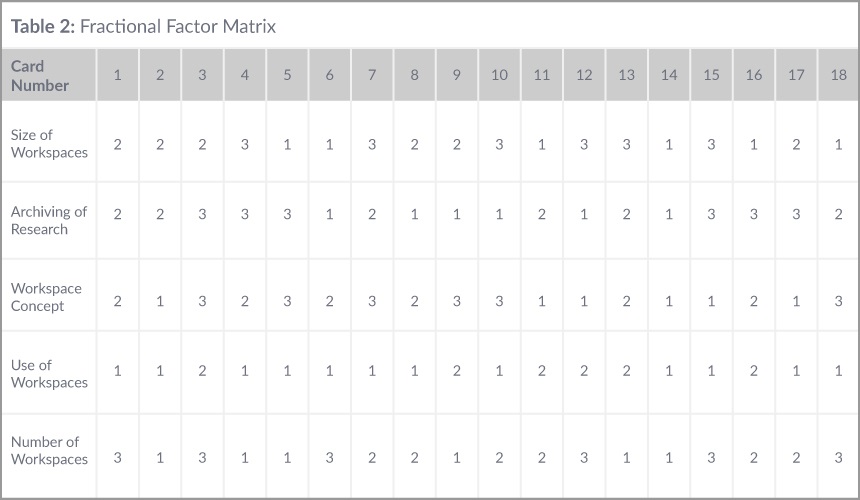
In the hospital office innovation case, physicians were asked to rank the 18 vignettes. The rankings were captured in a database for analysis. By grouping the physicians by department, departmental preference profiles were developed.
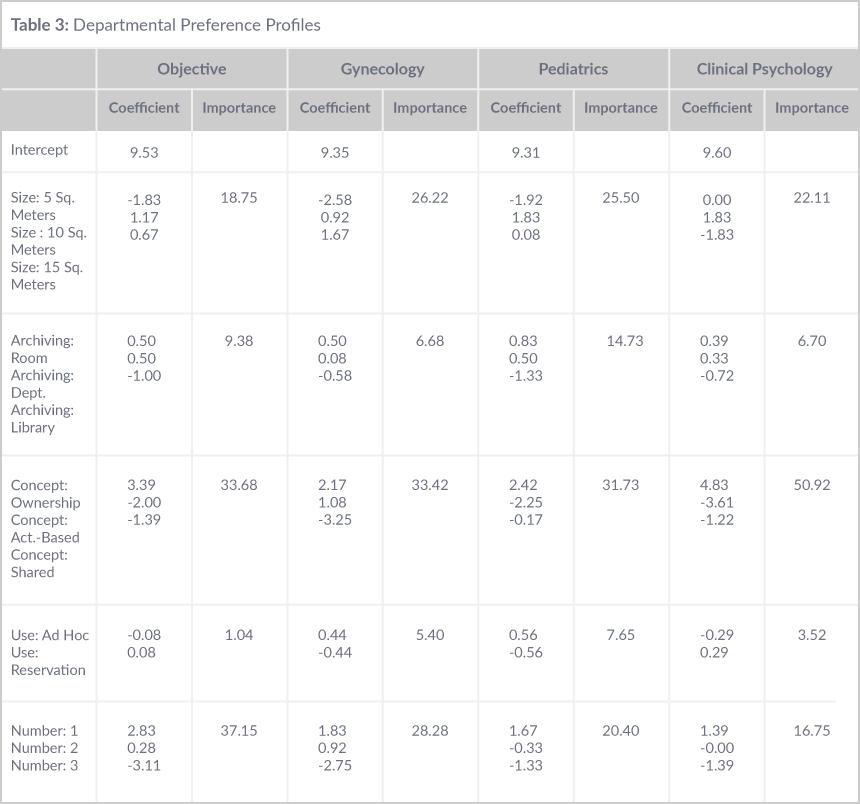
With the exception of genetics, all department representatives attached the highest importance to the workspace concept, with strong preferences for individual ownership of a workspace. As expected, bigger workspaces were preferred over smaller workspaces and the preferred number of workspaces per room was limited to one or two.
Based on these departmental preference profiles, it was concluded that office innovation was not feasible for the hospital staff. But this was not the whole story. In order to assess hidden trends in the data, the individual preference profiles were entered into a cluster procedure (using a “complete” clustering algorithm). All individuals were assigned to one of two clusters. Per cluster, new preference profiles were developed.
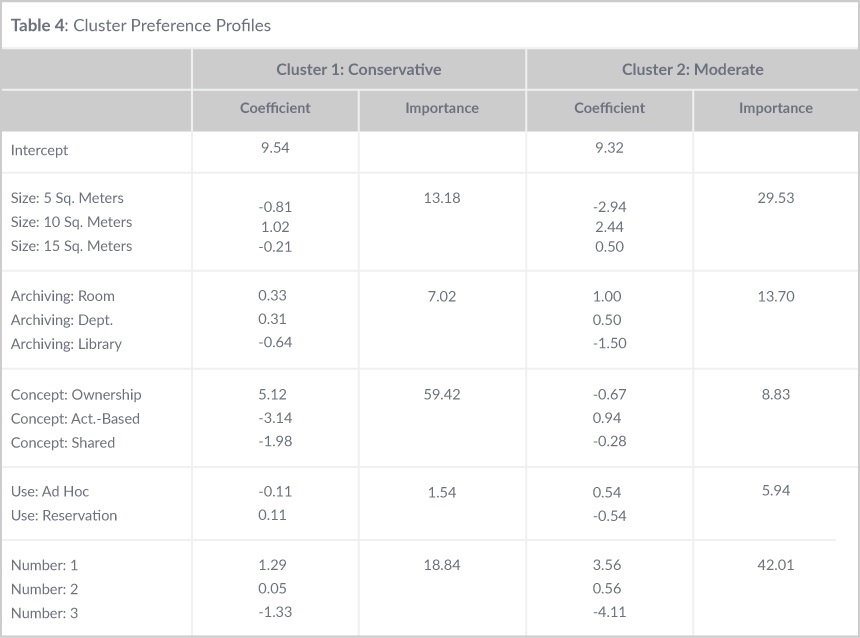 From the cluster preference profiles, a “conservative” cluster (70 percent of the respondents) and a “moderate” cluster (30 percent of the respondents) could be distinguished. The conservative group shared a strong preference for the ownership of the workspace (importance: 59 percent), even if this meant the workspace would be relatively small. The moderate cluster was relatively indifferent to the concept (ownership or shared workspaces), but preferred larger workspaces and fewer workspaces per room.

By discovering these hidden trends in the data, the audience could be profiled according to a clustering that was specific to the underlying needs. These profiles did not appear by simply grouping the individuals according to a pre-existing criterion (such as department). In this hospital case, a group of individuals shared an extreme preference for the ownership concept, whereas others were more moderate in their preferences and could feel happy in larger, shared workspaces.
Conclusion: Consider Customer Complexity
The Six Sigma process starts with the voice of the customer and the identification of the customers’ critical requirements. Since the VOC can be ambiguous and heterogeneous across customer segments, a Six Sigma project can only be successful by taking this complexity into account. A method to accomplish this is conjoint analysis. The hospital example shows how individual and departmental preference profiles were developed for the layout of a new hospital staff area. And it also shows how a clustering algorithm can be applied to the individual preferences in order to develop cluster preference profiles. These cluster preference profiles show hidden trends in the data that can be extremely useful for profiling. In this way, products and services can be targeted according to a segmented set of requirements and improve overall customer satisfaction.