
Key Points
- Trend charts are used to see the changes throughout a process.
- They come in different forms like the run, control, and time series charts.
Trend charts are used to monitor your process change over time. They can be used to identify trends going up or down, special patterns, or unusual occurrences. Let’s learn more about some of the most common trend charts.
Overview: What Are Trend Charts?
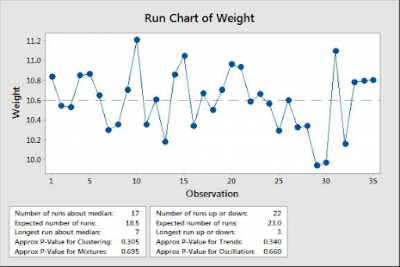
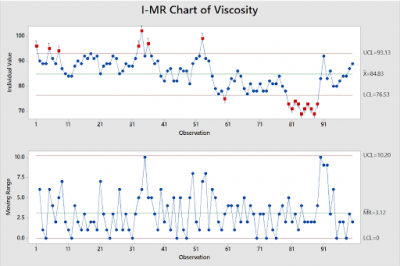
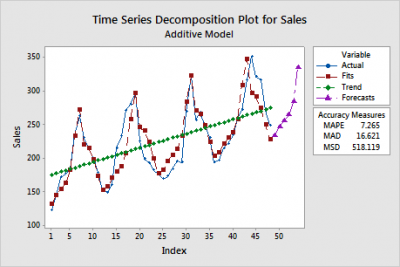
Some of the common trend charts are the run chart, control chart, and time series chart. The run chart is just the plotted data with the X axis being time. You can also analyze the pattern or sequence of points. A control chart adds the upper and lower control limits allowing you to determine if the pattern of the data is common or special cause. Time series is based on the concept of looking for patterns in the data and then extrapolating those patterns into the future. This is used in forecasting. Below are examples of each.
An Industry Example of a Trend Chart
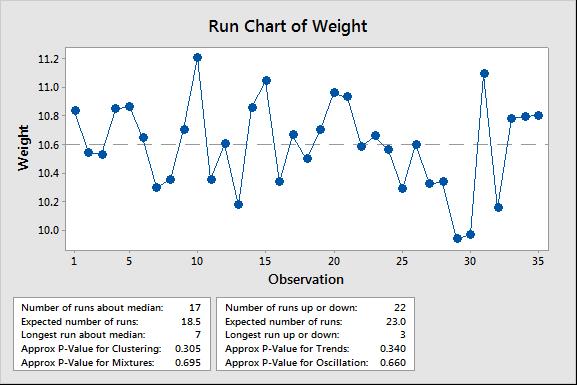
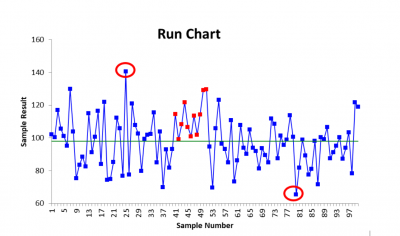
The company Black Belt (BB) was asked to comment on a trend chart developed by the manufacturing manager. He had noted a series of data points which were all in a row above the center line. He also questioned what was going on with the highest data point at time 25 and the lowest data point at time 80. The chart below is what he was looking at.
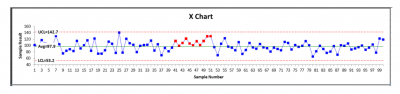
The BB decided to look at the same data as a control chart instead of a run chart. Below is the control chart and the BB’s interpretation.
The BB agreed there was a run of 11 points in a row above the center line. Since that is a signal of special cause variation he suggested the manager investigate and see if he could find an explanation. There was a momentary shift in the process The BB also pointed out that, since the values for points 25 and 81 are within the control limits they were common cause variation and no immediate action was called for.
Are Trend Charts Histograms?
No, a histogram doesn’t have a sense of time in the data it presents. A trend chart by its very definition has a time component to things. While histograms have their place, if you’re looking to see the changes in your data, you’ll want to lean on trend charts.
Other Useful Tools and Concepts
Looking for ways to bolster your control charts? You’re certainly in the right place. You might want to look into what techniques are used in assessing process stability. There is no shortage of techniques, but our guide handily shows you the best way of going about it.
Additionally, you might benefit from learning about trend analysis tools. No one can tell the future, but trend analysis allows you to make decisions based on hard data you have to forecast potential events.