
Control Chart Suggestion
Individuals And Moving Range – X and Rm
Control Chart Description
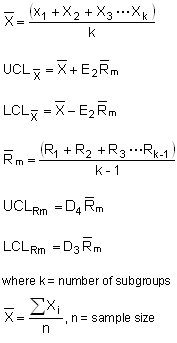
Control charts for individual measurements (e.g., the sample size = 1) use the moving range of two successive observations to measure the process variability. The combination of the X Chart for Individuals and the Moving Range chart is often called an X and Rm or XmR Chart.
Control Chart Formulae
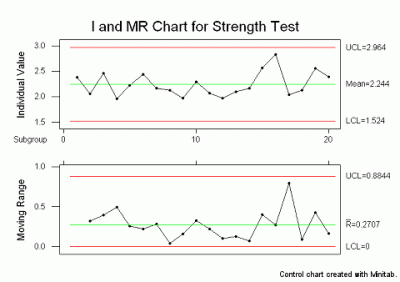
Control Chart Example
Additional Resources
- Individuals Control Charts
- Steps In Constructing an Individuals and Moving Range Control Chart
- Steps in Constructing an Exponentially Weighted Moving Average (EWMA) Chart
- Additional Control Chart Links