
© Juice Flair/Shutterstock.com
CoV is a simple calculation to measure the variation in your process. Let’s see how to do the calculation, explore an industry application, and answer a few questions about CoV.
Overview: What is the Coefficient of Variation?
CoV, also known as the relative standard deviation, is a dimensionless measure of relative variability. It is the ratio of the standard deviation and the mean of your data set. The formula is:

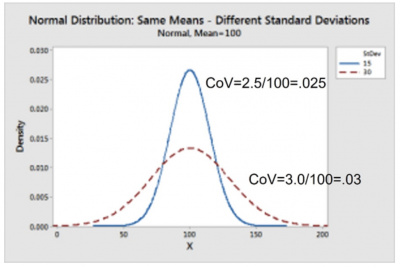
Graphically, this can be seen below. Note that the two means are equal, but the two standard deviations are different. The larger standard deviation has a CoV of 0.03, or 3%, while the smaller standard deviation results in a CoV of 0.025, or 2.5%.
Visually, the curve with less variation has a smaller CoV. This is interpreted as meaning the dispersion of points around the mean is less for the blue curve than for the dashed red curve. Less variation in your process is preferred.
Comparing the coefficient of variation
An Industry Example
A customer call center was evaluating the performance of two of their associate teams concerning the time they spend on a customer call. Data was collected, and the mean and standard deviation of call time were calculated.
The call center manager decided to calculate the coefficient of variation to compare the two teams. While the average call time was close (4.5 minutes vs. 4.3) one team had a standard deviation of 1.5 minutes, while the other was 2.75 minutes, respectively. This resulted in a CoV of 33.33% vs. 64%.
The manager formed an improvement team to try to find the root cause of why one team had a relative variability almost double the other team. The root cause was found to be a result of training, tenure and supervisor. Changes were made, and both teams then performed with minimal call length variation.
Other Useful Tools and Concepts
Looking for other tools to bolster your production? You might want to familiarize yourself with the Y=f(x) methodology. This calculation can apply to all steps of production and is well worth paying attention to regardless of what stage in your processes you might be in.
Additionally, learning how to create a standard operating sheet is a great way to keep all of your team members on the same page. This document outlines everything in your process while engaging your employees directly.