Ask someone to tell you how long their commute is, and they can probably provide an average number without much thought. But ask them how much it varies, and they will most likely have to pause and consider first how to answer that question and then think of actual numbers.
One might tell you the shortest and longest it has ever been, while another might tell you it is “typically” between two numbers without any definition of what “typically” means.
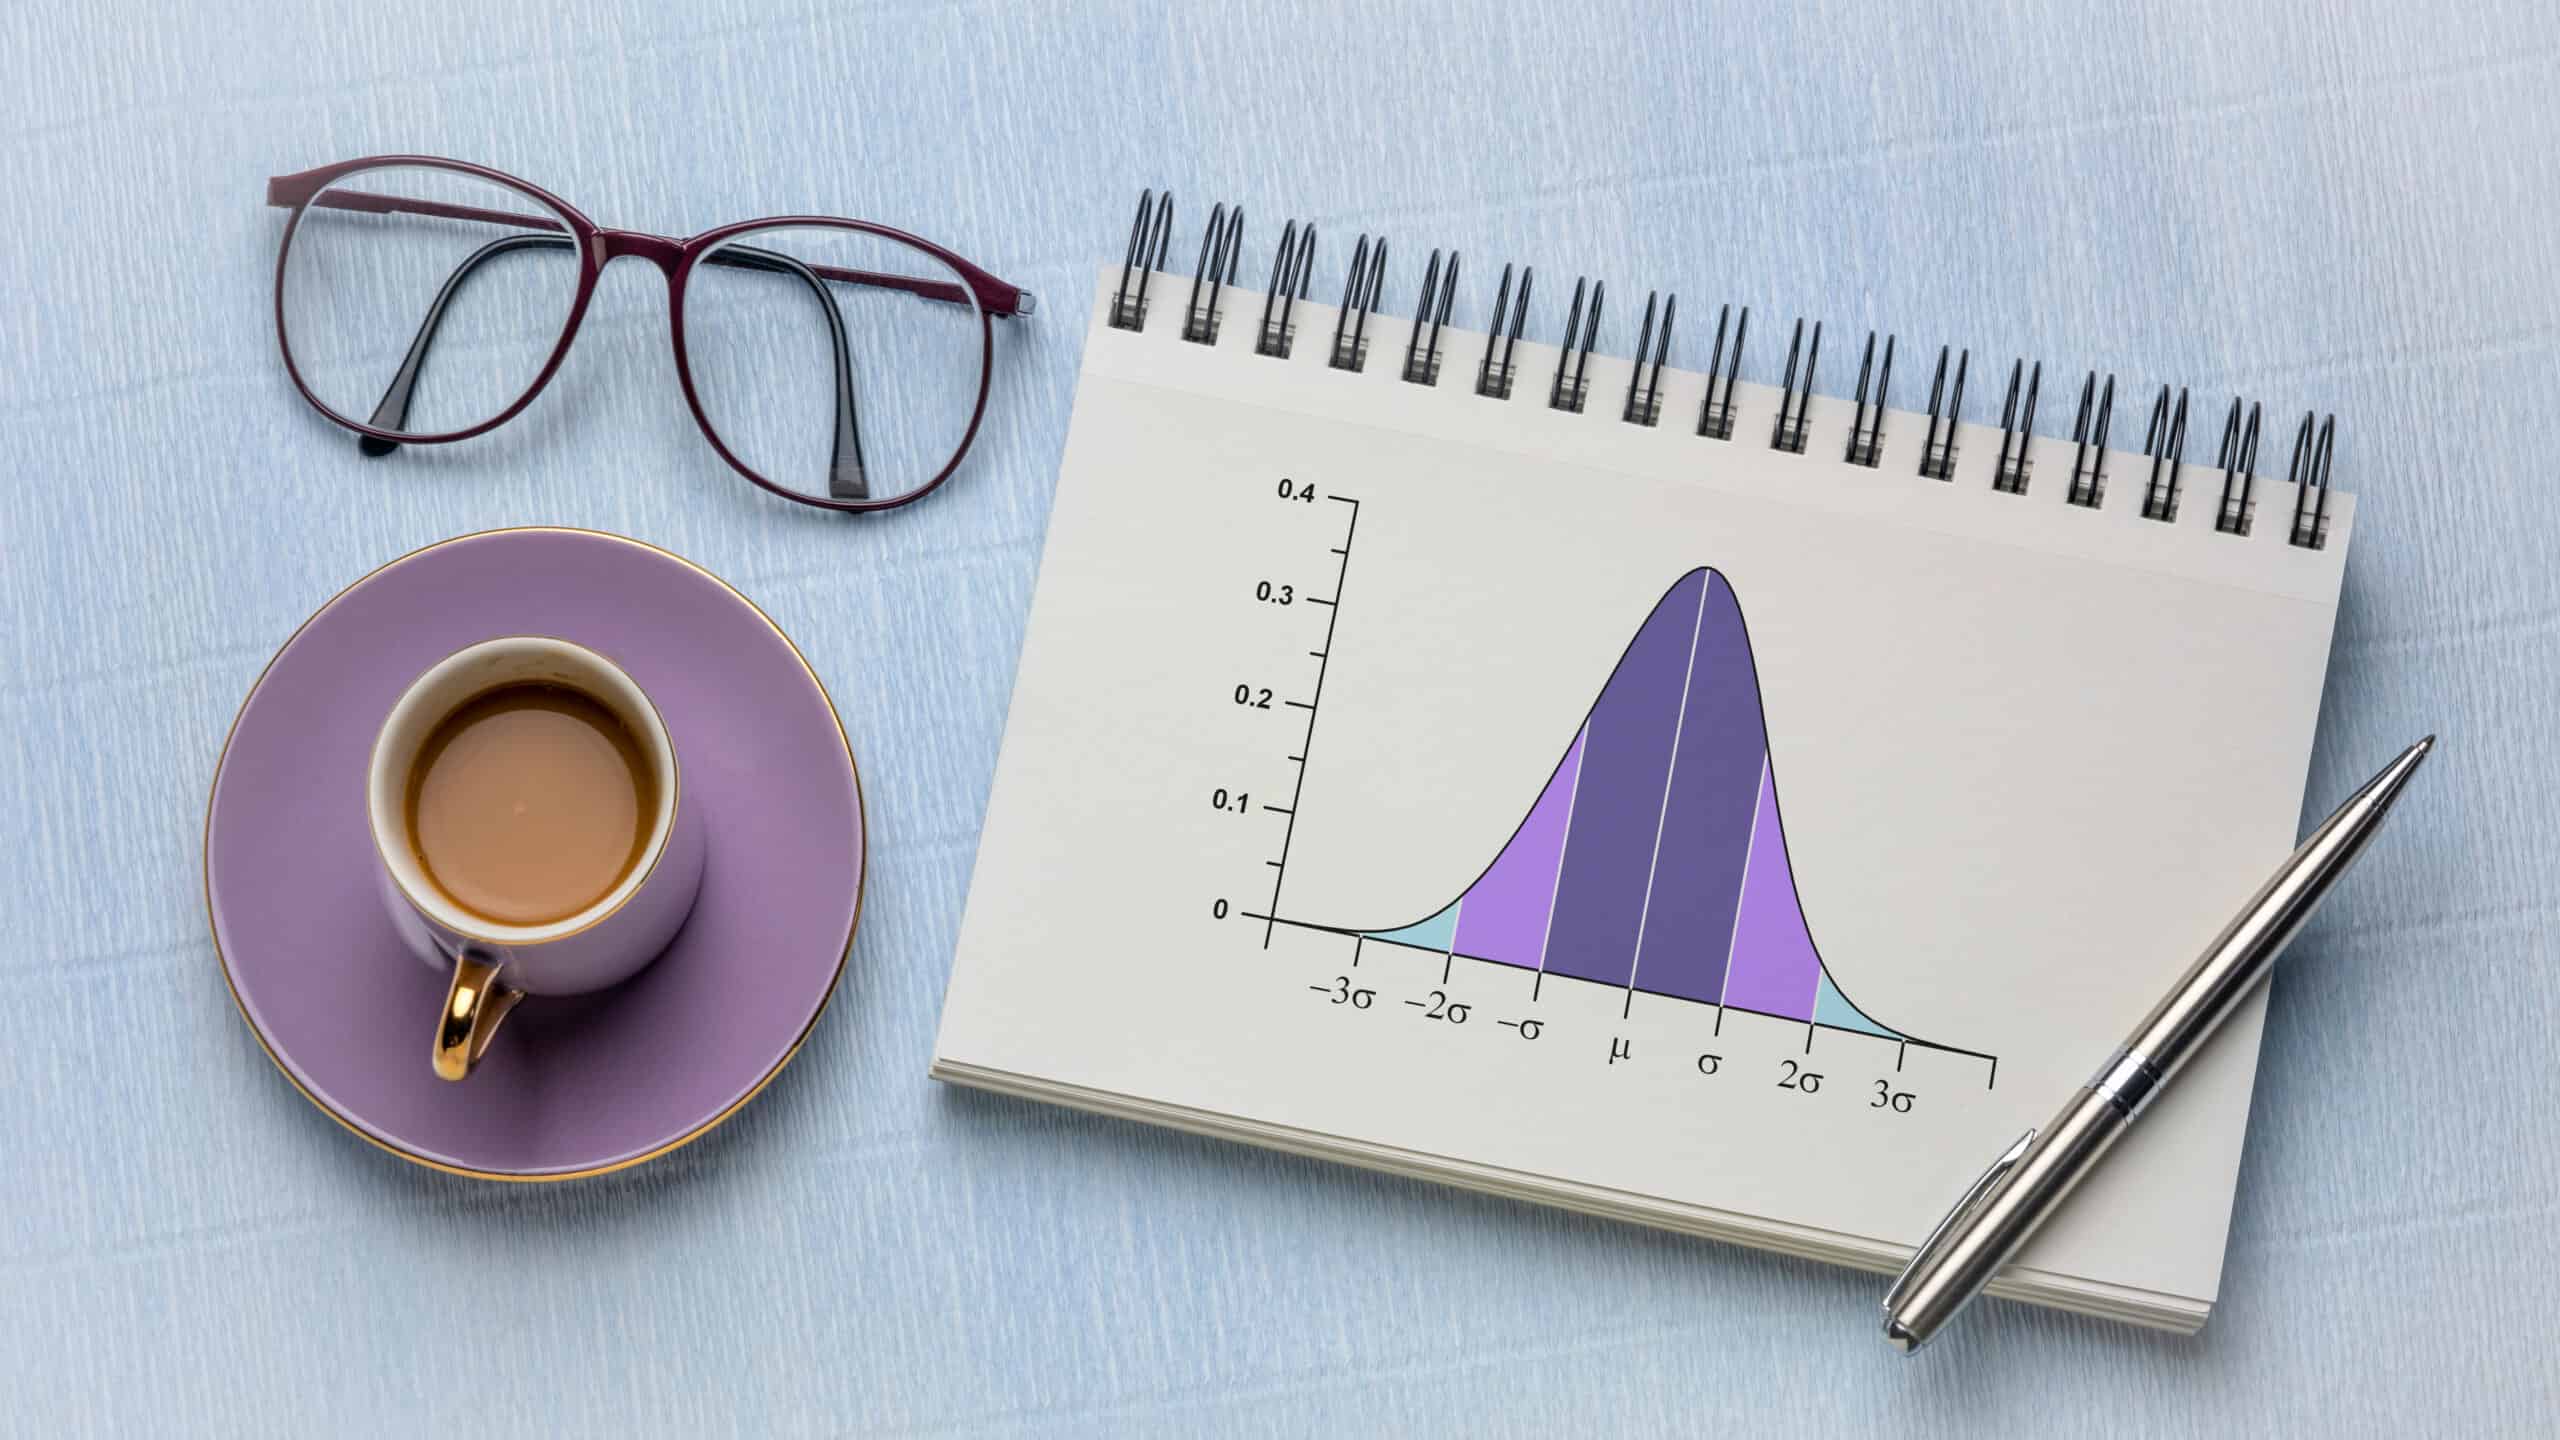
Standard deviation is a single number that quantifies the variation a process and, combined with a measure of central tendency and distribution, allows us to put specific probabilities on certain ranges of values occurring. For example, you could utilize the statistic to identify the range of values that would include 90% of commute times in it.
Overview: What Is Standard Deviation?
For continuous data, the sample standard deviation is a calculated value that is often described as the average squared distance between each data point and the mean of the data. This provides an estimate of the population standard deviation, σ. The formula for calculating the sample standard deviation, s, is:
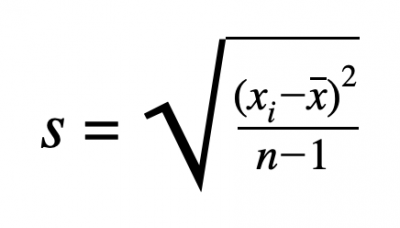
In the formula, xi represents each data point, the other x represents the mean of the dataset, and n represents the total number of data points in the dataset.
While the formula may seem complicated, standard deviation can be thought of as a “typical” distance from the average to a data point. For example, with the normal distribution, about two-thirds of the data points lie within one standard deviation of the mean, and about 95% fall within two standard deviations.
2 Benefits of Using Standard Deviation
Standard deviation is not some arbitrary measure of variation; in fact, it has some nice properties that make it an attractive statistic to use to describe the spread of a dataset or distribution.
1. Information
While the range of a dataset may be simpler to explain and calculate, it alone is not particularly informative as it only speaks to how spread apart the most extreme values in the dataset are. Standard deviation provides more information on where most data points will fall, especially when paired with knowledge of a specific distribution.
2. Units
The variance of a dataset – from which standard deviation is derived by taking the square root — has nice mathematical properties, but the units of the statistic are the original data units squared. This makes it hard to interpret and visualize. Standard deviation, on the other hand, is in the same units as the original data. For example, if a dataset is collected on the time it takes to complete a repetitive task in minutes, the standard deviation is also calculated in minutes.
Why Is Standard Deviation Important To Understand?
Standard deviation is not just a standalone measure of the spread of a dataset; it’s also used in a wide variety of applications.
It’s the Basis for Other Metrics
Many other statistics begin with a calculation of the standard deviation. For example, when considering normally-distributed data, the z-score is calculated as the number of standard deviations a particular point is from the mean. Sigma level is the number of standard deviations from the mean that would result in the estimated defect rate.
It’s also used to calculate test statistics for hypothesis tests, to set the control limits on control charts, and multiple other measures.
It Is the Standard
Depending on the situation and need, other statistics are used for describing the spread of a dataset, but none are used as frequently as standard deviation. It is the standard measure and provides a common metric used throughout the field of statistics.
An Industry Example of Standard Deviation

A manufacturer is supplied with a key raw material necessary for production. It is important to order the raw material far enough ahead of time to ensure it is extremely likely that it will arrive before production begins but, for economic reasons, not too far ahead of time. Due to logistics, potential issues on the vendor’s end and a variety of other reasons, the time from order until receipt varies.
By collecting data on the lead times for orders, the average and standard deviation can be estimated. The standard deviation then gives an understanding of how far from that average we might expect to see data, and what lead time would need to be planned around to ensure supply. For example, we might plan on a lead time three standard deviations longer than average.
2 Best Practices When Thinking About Standard Deviation
While it’s a very common metric, there are some best practices to consider when utilizing the standard deviation.
1. Ensure Stability
While the standard deviation can be calculated for any dataset, it should only be used to understand what to expect in the future for that process if the process is stable and remains that way.
2. Understand Distribution
While the standard deviation gives a general idea of spread, once the distribution of data is known, some very specific probabilities can be calculated from it.
Conclusion
The range is simple to calculate. Variances can be added. But standard deviation is king because it combines the use of original units with more complete information to provide the best overall measure of the spread of a dataset.