
What exactly is DPO?
As the quality engineer for the microwave top-level assembly line, you find yourself disappointed in the failure rate of the cover installation process. The failure rate seems stuck around 6% when looking at defects per unit standpoint, which is much higher than expected.
You dive into the data, hoping that the defects per opportunity tell a different story. Is there also a 6% chance for the failure to occur? This points towards poor process design, or is it a far smaller percentage chance?
Is it possibly pointing toward poor training or an uncalibrated tool? What is the DPO, or defects per opportunity?
An Overview of DPO
Defects per opportunity, commonly known as DPO, help give proper context to how often an error occurs within a process.
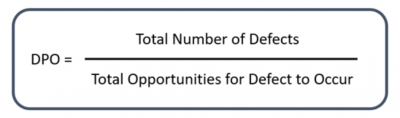
DPO is a ratio calculation. Using the calculation below, DPO gives the ratio between the total number of defects divided by the total possible opportunities that a defect could occur. Since you cannot have more occurrences than opportunities, the result will be a number between 0 and 1.
Using a manufacturing example, a top-level assembler for a microwave oven includes 10 screws used to fasten the case to the body of the microwave. During a shift, 50 microwaves have their cases fastened to the body. At the end of the shift, it is found that three microwaves have quality errors.
The first failed unit had eight screws that were installed with too little torque. The second and third each had two screws that were installed with too little torque. We take the 12 total errors and divide the number by 500. This is the total number of screws used during the shift for cover installation.
We conclude that the DPO for this process, over the timeframe measured, is 0.024 DPO. Put in simple terms, there is a 2.4% chance that a screw will be under-torqued every time a screw is tightened. This does not mean 2.4% of products will have defects since the operation occurs multiple times per product.
3 Benefits of Monitoring DPO
Understanding Failure Rate From an Opportunity Point of View
Unlike DPU, which gives you a better understanding of how many units to expect to leave the process with errors, DPO gives you an understanding of the true failure chance for a defect to occur.
In the example above, the DPU, or defects per unit, is 0.06, or a 6% chance of a unit having a failure. But from an opportunity point of view, the example above only shows a 0.024, or 2.4% chance of a failure per opportunity.
Because the operation occurs multiple times for a single unit, the two measurements tell two different stories.
DPO Is the Starting Point for Calculating DPMO
DPMO, or defects per million operations, is derived by first calculating DPO, and then multiplying the ratio by one million. This number is used to generate Six Sigma levels for a process.
Demonstrates the Failure Rate of Different Opportunities
Unlike other metrics, DPO helps demonstrate which types of failures have a higher rate of occurrence.
Best Practices for DPO

- While a great measurement for determining the likelihood of a failure occurring per opportunity, it does not give you an understanding of the failure rate per unit produced or service provided. You can have a low DPO and still have a startlingly high unit failure rate or DPU.
- Other defect measurements to use in conjunction with defects per opportunity include defects per unit, defects per million opportunities, and parts per million (units defective). Note that the product or service provided is the unit. Further, customer specifications such as size, shape, material, and timeliness are opportunities.
- Be sure to understand what constitutes a defect. In general, a defect is defined as a property of the product or service that does not meet customer specifications.
Other Useful Tools and Concepts
While we’ve talked all about DPO, there is more to consider when analyzing your workflow. As such, understanding how control limits relate to your statistical analysis is key. Having upper and lower thresholds helps to detect extreme values, which in turn could point to issues further down the line.
Since we’ve discussed DPO in-depth, you might want to see how it relates to the likes of DPMO, Sigma Level, and Cpk. Our guide on the subject covers how these calculations relate to your production line and shows you how to convert between units with utter ease.
DPO Demonstrates the Chance of a Failure to Occur
Defects per opportunity give you the failure rate for a particular failure to occur. Monitoring different periods will allow for a better understanding if a particular failure rate is improving, but it may not show whether yields are improving on a unit basis.
When used in conjunction with other quality metrics, it can give a clear picture regarding the quality of the product produced or service being provided.