
Statistical analysis is a vital component of improving workflows in a given project. To make the most of your data analysis, you’ll want to use ANOVA. So, what exactly is ANOVA? While this can seem a bit heady at first glance, getting to grips with ANOVA can provide valuable insights into how your production is functioning.
Overview: What Is the F-value in the Context of ANOVA?
First, we need to start by describing what we mean by ANOVA. ANOVA is a statistical hypothesis test that allows you to determine whether there is a statistical difference between the means of three or more groups. While other hypothesis tests for differences in means directly use the data means (T-test), ANOVA is unique in that it uses a sum of squares approach similar to variance to determine whether means are statistically different or not.
ANOVA looks at three sources of variability:
- Total: Total variability among all observations
- Between: Variation between subgroup means (signal)
- Within: Random (chance) variation within each subgroup (noise)
The F-value is the ratio (F-ratio) of the Between and Within variation. Below is a graphic showing how the two variations are determined.
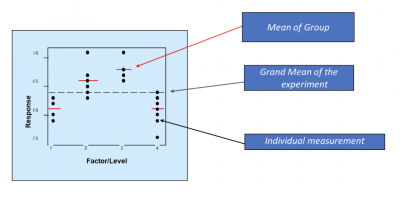
The Between variation is calculated by summing the squared differences between the group means and the grand mean. The Within variation is calculated by summing the squares of the difference between the individual values and the group mean.
How to Calculate Your Variability
So, how do you calculate this variation? Take a look at the figures below.
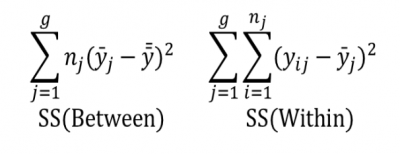
The Between (Factor) and Within (Error) variations are now put in the form of a ratio. This ratio is called the F-ratio, and the resulting value of that ratio is called the F-value.

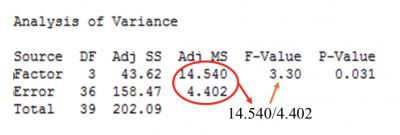
The F-value and the calculations are typically represented in an ANOVA table as shown below:
Now that you understand what the F-value is and how it is calculated. However, you might be wondering how to use the F-value to decide the means of your groups. Conceptually, the F-value is now overlaid on the F distribution, as shown below.
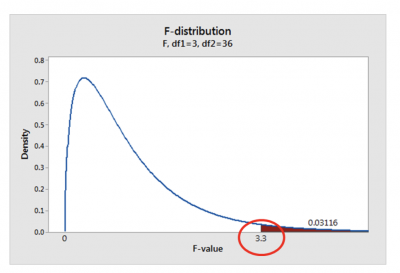
The number to the right (0.03116) is the p-value and determines whether to reject or fail to reject the null hypothesis (Ho) of ANOVA. The Ho is that all group means are statistically equal. The alternate hypothesis (Ha) is that at least one group’s mean is different.
Using an alpha value of 0.05, you will reject the null and claim there is a difference in the means of your groups. Further, this assumes you have fulfilled the assumptions of the ANOVA test, especially that the variances of the groups are equal.
3 Benefits of the F-value
Here are some of the key benefits of using the F-value to make decisions during your data analysis.
Simple Ratio
The F-value is a ratio of two sum-of-squares calculations. As such, the resulting value is used to determine what action to take concerning the null hypothesis.
Statistically Based Decision Making
Thankfully, it is easy to determine whether multiple group means are mathematically different. However, the mathematical difference does not indicate whether that difference is a real difference or just a random variation.
Software
Currently, most statistical software today does all the necessary calculations of the sum of squares, F-value, and p-value. This is usually presented in an ANOVA table for easy understanding and interpretation.
Why Is the F-value Important to Understand?
The F-value is a popular and powerful statistical tool for making decisions regarding differences in group means. However, it is important to understand for the following reasons.
Based on Group Sum of Squares, Not Direct Group Means
While it might seem counter-intuitive, you can use variances to make decisions about means.
ANOVA Assumptions
For the F-value and p-value to have meaning, you must adhere to the assumptions of ANOVA – particularly that the variances of the different groups should be equal.
Interpretation of the F-value
ANOVA uses the F-value to determine whether the between-group variability of means is larger than the within-group variability of the individual values. Accordingly, if the ratio of between group and within-group variation is sufficiently large, you can conclude that not all the means are equal.
An Industry Example of the F-value
A plant manager is trying to determine if there is any true difference between the productivity of his three manufacturing shifts. Accordingly, he has collected data based on the three shifts at the plant.
His LSS Black Belt, Travis, volunteered to do an ANOVA test to see if there was any significant difference in the mean production of the three shifts.
Travis tested the two ANOVA assumptions of normality of the three data sets using the Anderson-Darling normality test and the equality of variances using the Bartlett test. Both assumptions were fulfilled.
See the results below.
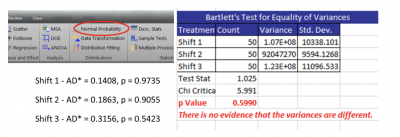
Note that all the p-values are higher than an alpha of 0.05, so you can state that the three data sets are not different than normal. As such, you can also see that the three variances are equal. Afterward, Travis then ran the ANOVA using a statistical software package. The results are presented below.
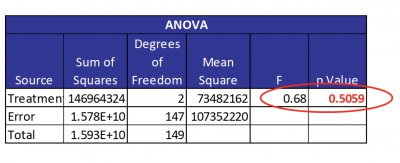
Since there was a small F-value of 0.68 and a large p-value of 0.5059, Travis concluded there was no difference in the production means of the three shifts.
3 Best Practices When Thinking About the F-value

While your statistical software will do all the calculations, there are some things you can do to be sure your results are meaningful
Test All Assumptions of ANOVA
The two primary assumptions of ANOVA are that each group of data needs to be normally distributed, and the variance of the groups needs to be equal. However, if the assumptions are seriously violated, you may need to use a non-parametric test to determine whether your groups are statistically different.
Select an Appropriate Alpha Value
Depending on the question you are trying to answer, you can select alpha values of 0.01, 0.05, 0.10, or any other reasonable value.
Do a Measured System Analysis
Unless you are confident in the ability of your measurement system to collect valid data, your results may be questionable.
Take Your Analysis Further With These Tools
While F-value and ANOVA are useful means of hypothesis testing, you might need something else. In that case, you might want to utilize the likes of the Taguchi Method. This comprehensive guide covers how it applies to experimental design and analysis.
Alternatively, if you need additional concepts to fuel your statistical analysis, then specification limits might be in order. Our guide on upper specification limits details how implementing these concepts in your measurements can benefit your process improvement cycle.
Conclusion
The F-value is the result of an ANOVA hypothesis test for determining whether there is a statistically significant difference in the means of three or more groups of data. As such, the F-value is the ratio of the sum of squares for the difference between each group mean and the grand mean (between variation) and the sum of squares for the difference between the individual values and the group mean (within variation).
Utilizing ANOVA and finding the F-value is a powerful means of data analysis. In production, you need every edge you can get. As such, you owe it to yourself to leverage this powerful means of analyzing variance in your workflow.