
The T test is a statistical tool you would use to determine if there is any difference in average performance before and after a machine retrofit. Or whether the average weight of raw materials provided by two vendors was statistically the same or not. Let’s learn a little more about this powerful statistical technique.
Overview: What is the T test?
The T test, also known as the 2-sample t test or Student’s t test, tells you whether the differences between two group means are significant or happened by chance. The T test is a hypothesis test used when your data sets follow a normal distribution but the population variance is unknown.
Since the T test is a hypothesis test, there must be a null (Ho) and alternative (Ha) hypothesis. The Ho is::
- Ho: mu1 = mu2 (the two population means are equal)
The Ha can be either two-tailed, left-one tailed, or right-one tailed: Here are the alternative hypotheses:
- Ha: (two-tailed): mu1 does not equal mu2 (the two population means are not equal)
- Ha: (left-tailed): mu1 < mu2 (population 1 mean is less than population 2 mean)
- Ha: (right-tailed): mu1> mu2 (population 1 mean is greater than population 2 mean)
How big does the difference in means have to be before you can conclude it is significant? Every T value has a p-value to go with it. The p-value is the probability that the results from your sample data occurred by chance. P-values range from 0.0 to 1.0.
If the p-value corresponding to your T test with (n1 + n2 – 2) degrees of freedom is less than your chosen alpha risk, then you can reject the null hypothesis thereby claiming there is a statistically significant difference in the means of the two populations from which the samples came from.
An industry example of the T test
The sales manager was trying to compare the sales performance of two sales offices. She collected data from both and was advised by her company’s Six Sigma Master Black Belt to use a T test to see if they were selling at an equal rate. Below are the results of her analysis.
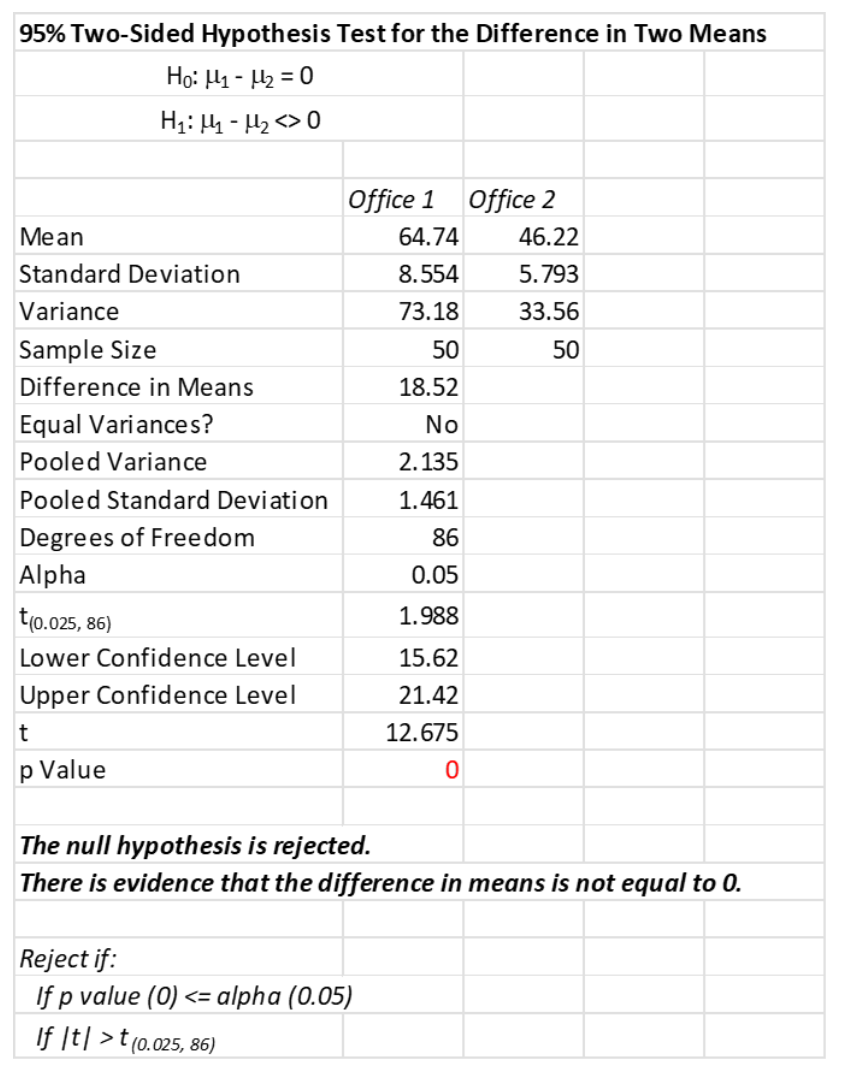
Since the p-value is less than the assumed alpha risk of .05, you can reject the Ho and conclude there is a statistically significant difference between the average sales performance of the two offices with Office 1 doing significantly better than Office 2.
Frequently Asked Questions (FAQ) about the T test
Is the T test assumption of normality of my data sets very strict?
The assumption of normality is quite robust so a slight violation is not a problem, especially if you have a large enough sample size.
Is the T test comparing the means of my two samples?
No. The conclusion of the T test is whether the means of the two samples came from two populations with the same means.
What are common values for alpha risk when using a T test?
Some of the common values are .01, .05 and .10 which correlate to confidence levels of 99%, 95% and 90%.