
Because of variation in the data you use for analysis, point estimates are often not reliable enough. That is why it is necessary to account for that variation by using a prediction band, and where appropriate, a confidence band or interval.
Overview: What is a prediction band?
In regression analysis, a prediction band is similar in concept to a confidence band. A confidence band is defined as a plausible range of values for your population parameter (eg. mean or standard deviation) based on taking your sample statistic estimate and adding and subtracting a margin of error. Graphically, it is often represented as a dashed line on either side of the fitted line or probability plot.
On the other hand, a prediction band is the lines on a probability plot or fitted line plot which show the upper and lower bounds for all points on a fitted line within the range of data. In regression, at some desired level of confidence, the prediction band will show the plausible range of values for the individual data point for expected new observations.
The confidence bands above and below the fitted line represent confidence intervals for the mean response for some predictor variable whereas the prediction bands describe the expected interval for the individual values, not the mean.
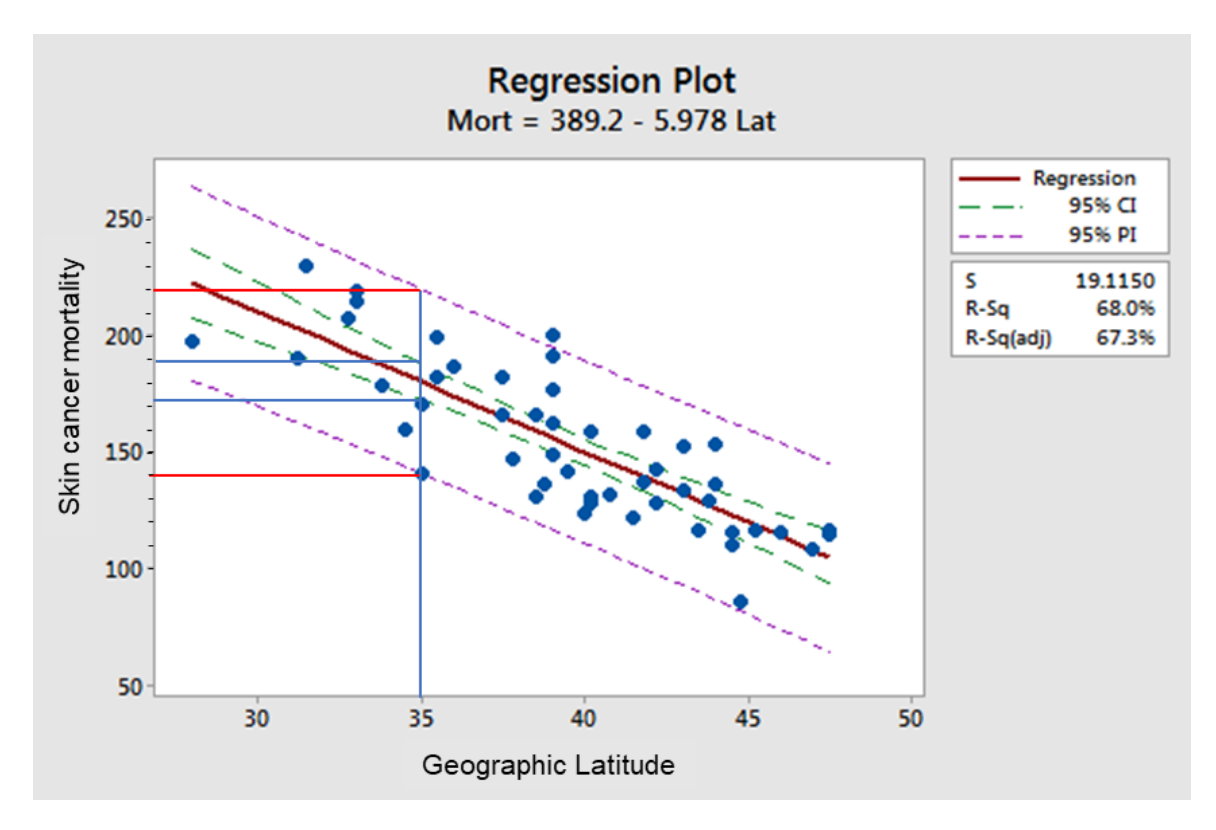
In the example below, the model indicates that with a 95% confidence level a Geographic Latitude of 35 will generate a mean Skin Cancer Mortality between approximately 172 and 190 which are the y values of the lower and upper confidence bands at X = 35. Based on the prediction bands, future individual observations at a Geographic Latitude of 35 should fall within a Skin Cancer Mortality range of 140 to 220 which are the y values of the lower and upper confidence bands at X = 35.
An industry example of a prediction band
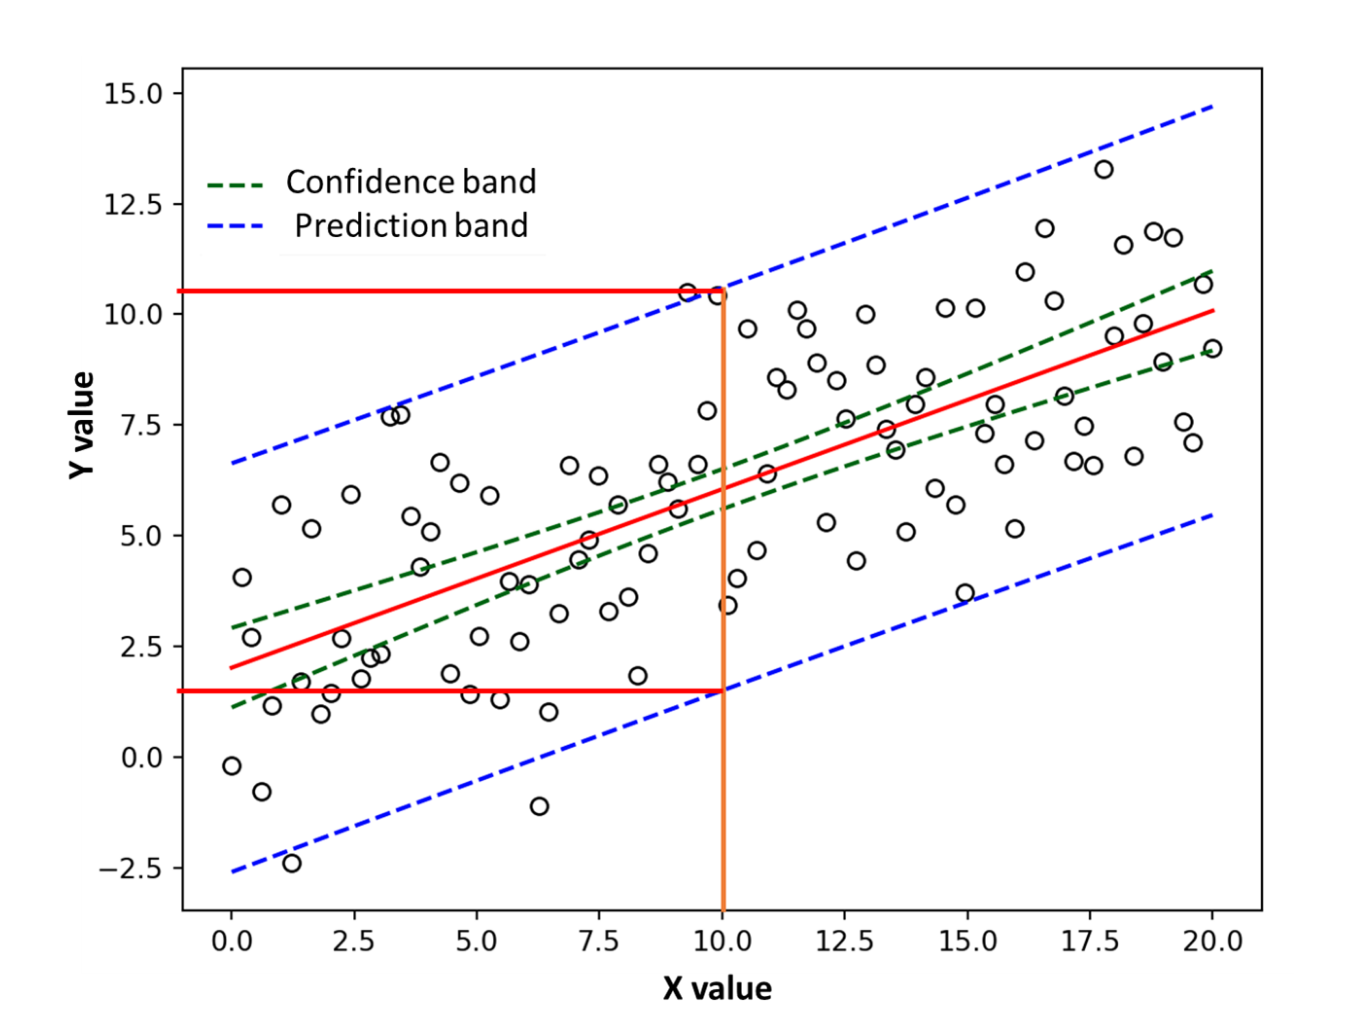
A Six Sigma Master Black Belt (MBB) was assigned to a project seeking to understand the relationship between an X variable, speed and a Y variable, viscosity. The regression scatter plot below was analyzed with the confidence and prediction bands to get more insight into the relationship and implications for future data. Based on the prediction bands, the MBB was able to predict that for a speed of 10, the expected individual observations for viscosity should fall between 1.25 and a little over 10. This was a pretty wide range, so the team focused on why there was so much variation in the process.
Frequently Asked Questions (FAQ) about a prediction band
In regression analysis, what is the difference between a prediction band and a confidence band?
The confidence band shows the range of plausible values for the fitted line at some specified confidence level. The prediction band indicates the range of plausible values for new observations at a specified confidence level.
What do prediction bands tell me?
Prediction bands show you the range of where you can expect your data to fall. Assuming a 95% confidence level, you should expect 95% of your future data points to lie within the prediction bands.
What is a prediction band?
A prediction band is used to represent the uncertainty in an estimated future Y value for some specific value of X. Prediction bands are often used in regression analysis as part of the graphical output of results.