
The measurement system for attribute data (type of defect, categories, survey rankings, etc.) requires a different analysis than continuous data (time, length, weight, etc.).
For continuous data, you would use Measurement System Analysis or Gage R&R to judge the capability of your measurement system to give you reliable and believable data.
An Attribute Agreement Analysis relying on Kappa is used for the same purpose but for attribute data. This article will describe the calculations and interpretation of Kappa along with its benefits and best practices.
Overview: What is Kappa?
Kappa measures the degree of agreement between multiple people making qualitative judgements about an attribute measure.
As an example, let’s say you have three people making a judgement on the quality of a customer phone call. Each rater can assign a good or bad value to each call. To have any confidence in the rating results, all three raters should agree with each other on the value assigned to each call (reproducibility). Plus, if the call is recorded and listened to again, each rater should agree with him/herself the second time around (repeatability).
The Kappa statistic tells you whether your measurement system is better than random chance. If there is significant agreement, the ratings are probably accurate. If agreement is poor, you might question the usefulness of your measurement system.
Kappa is the ratio of the proportion of times the raters agree (adjusted for agreement by chance) to the maximum proportion of times the raters could have agreed (adjusted for agreement by chance). The formula is:

P observed is the sum of the proportions when both raters agree something is good plus when both raters agree something is bad. P chance is the proportion of agreements expected by chance = (proportion rater A says good x the proportion rater B says good) + (proportion rater A says bad x the proportion B says bad).
Using the following sample set of data for our three raters listening to 20 calls twice, let’s see how to calculate Kappa for rater A. This calculation will be looking at repeatability, or the ability of rater A to be consistent in their rating. We would use the same method for calculating Kappa for raters B and C.
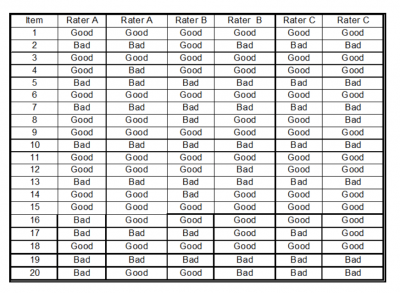
Step 1 is to create a summary table of the results.
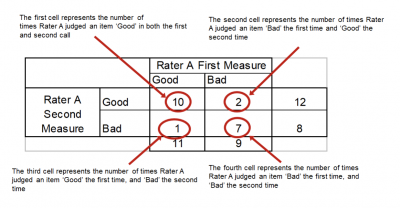
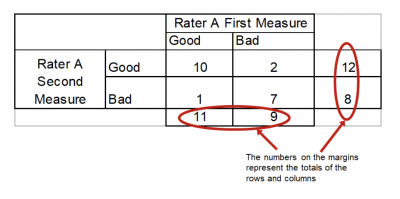
Step 2 is to create a contingency table of probabilities.
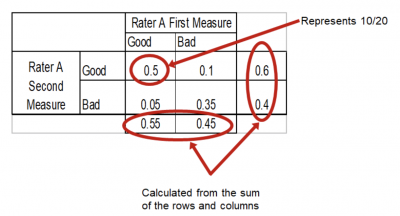
Step 3 is to do the calculations.

A similar process would be followed for calculating the within Kappas for raters B and C, and the between Kappa for all the raters. If repeatability for raters is poor, then reproducibility is meaningless.
The interpretation of the Kappa value is pretty simple. Kappa values range from –1 to +1. The higher the Kappa, the stronger the agreement and more reliable your measurement system.
- When Kappa = 1, perfect agreement exists
- When Kappa = 0, agreement is the same as would be expected by chance
- When Kappa < 0, agreement is weaker than expected by chance; this rarely occurs
Common practice suggests that a Kappa value of at least 0.70-0.75 indicates good agreement, while you would like to see values such as 0.90.
For the example above, the Kappa is 0.693, which is less than you would like to see, but is high enough to warrant further investigation and improvement of the measurement system. In most cases, improving the operational definition of the attribute will help improve the overall Kappa score.
3 benefits of Kappa
Having a quantitative measurement of the quality of your measurement system brings a number of benefits. Here are a few.
1. Quantitative value for measurement system performance
High or low values of Kappa provide a relative quantitative measure for determining if the data from your measurement system can be believed and trusted.
2. Simple calculation
The four primary mathematical operations of adding, subtracting, multiplying, and dividing are the extent of math skills necessary for calculating Kappa.
3. Statistical significance
An acceptable value for Kappa has been suggested to be around 0.70-0.75. Most statistical software will actually provide a p-value for the Kappa to indicate whether it is statistically significant.
Why is Kappa important to understand?
Calculations and interpretation of Kappa are important if you want to understand the validity of your measurement system.
Attribute Agreement Analysis vs. Gage R&R
Attribute Agreement Analysis is used for attribute data, while Gage R&R is used for continuous data. If you are able to convert your attribute data to some form of continuous data, Gage R&R is a more powerful tool for measurement system analysis.
Most common measure of intra- and inter-rater reliability
If you can’t agree with yourself when rating an attribute, it’s not possible for you to agree with other raters. In other words, in the absence of repeatability, there can be no reproducibility. On the other hand, repeatability does not guarantee reproducibility. All raters are consistent with themselves but can’t agree. These are separate issues of a measurement system.
Works the same for ordinal data as for binary data
Whether your attribute is of the form good/bad or a scale of 1-5, the technique, calculations, and interpretation are the same.
An industry example of Kappa
The training manager of a large law firm was training staff to proofread legal documents. She decided to try an Attribute Agreement Analysis to see if they would be able to assess the quality of documents on a scale of -2, -1, 0, 1, 2.
She selected 15 documents of varying quality and had them assess each document twice. She allowed a time interval of one week between the two readings to eliminate any bias due to remembering how they rated the document the first time.
The general counsel also rated the documents so they had a standard to measure against for accuracy. Here is a partial representation of the output from the statistical software they used for analysis and calculations of Kappa.
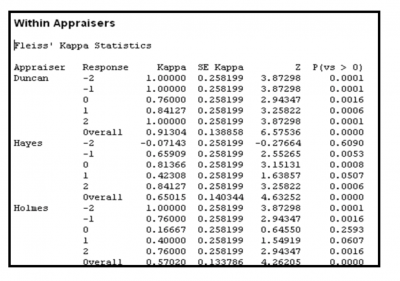
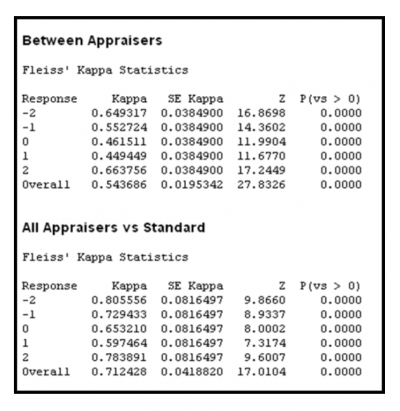
You can see that there is quite a bit of variation in Kappa values for within rater, between rater, and in comparison to the standard.
After reviewing the operational definitions of the scale, they went back and made them clearer so there was no misunderstanding what each scale value meant. They repeated the analysis, and the Kappa values were now within an acceptable range.
3 best practices when thinking about Kappa
Kappa is the output of doing an Attribute Agreement Analysis. Setting up and executing the technique and testing process will affect your ultimate calculations.
1. Operational definitions
When deciding on the attribute you wish to measure, it is critical there is a clear and agreed-upon operational definition to eliminate any variation due to conflicting definitions of what you are measuring. What does “good” mean? What does a 3 mean on a 1 to 5 scale?
2. Selecting items for your study
Be sure you have representative items in your study for the different conditions of your attribute. If you are measuring things that are good/bad, be sure you have about half and half in your study.
3. Testing against a standard
There are three common characteristics of your measurement system when doing an Attribute Agreement Analysis. These are intra-rater repeatability, inter-rater reproducibility, and agreement with a standard as a measure of accuracy. You can have excellent repeatability but always be wrong. Multiple raters can agree, but they all can be wrong when compared to the standard or expert rating.
Frequently Asked Questions (FAQ) about Kappa
1. What does Kappa measure?
It’s a statistic that indicates the reliability of your attribute measurement system. It measures the degree of rater agreement beyond that expected by chance.
2. What is an acceptable value for the Kappa statistic?
Most sources agree that a Kappa value in the range of 0.70-0.75 is acceptable, with higher values being preferred.
3. What does a negative Kappa value mean?
Any Kappa value below 0 means that agreement was less than would have been expected by chance only. Your raters may have done better by just guessing.
Agreeing on what Kappa is
Kappa is a form of measurement system analysis for attribute data. Multiple raters are used to make judgements on the characteristic of an item whether it be a simple yes/no or a value on an ordinal scale. The subsequent calculation of Kappa summarizes the degree of agreement among the different raters while removing agreement that could occur by pure chance.
The interpretation of Kappa often follows these guidelines:
- <0 No agreement
- 0 – .20 Slight
- .21 – .40 Fair
- .41 – .60 Moderate
- .61 – .80 Substantial
- .81 – 1.0 Perfect