
KJ is a simple tool to help you organize ideas into meaningful categories by establishing themes across multiple common ideas.
When you get to the Analyze phase of DMAIC, you will be challenged to come up with ideas on the root causes of your project’s problems. KJ is one of the tools in a sequence of steps to diagnose your process.
Overview: What is KJ?
Jiro Kawakita was an ethnographer whose work in organizing notes when researching problems led to the development of the Affinity Diagram. Since Kawakita developed this tool, it is also referred to as the KJ method or KJ diagram.
The KJ method, or Affinity Diagram, uses the following steps:
- Gather ideas: While brainstorming, gather as many ideas as you can on the stated problem you are analyzing. The preferred format is using sticky notes for each individual idea.
- Organize: Using a large wall or piece of paper, put the Post-It Notes on the wall, trying to consolidate and group similar ideas together. No judgment should be made at this time. If you feel some ideas can be in two groups, or are repetitive, that’s OK, just put them up. You can reorganize or eliminate them later.
- Select a theme for the grouping: If one grouping deals with issues of training, then title a larger or different colored sticky note “TRAINING,” and put all the ideas pertaining to training under it.
- Reorganize as needed: You can now reorganize or eliminate redundant or duplicate ideas for each theme.
- Deeper dive: Often, the next step is to use your Affinity Diagram as the foundation for a Fishbone or Ishikawa Diagram. Your themes can become the title of the main bones, and the individual ideas can serve as the starting points for the cascading analysis of cause and effect.
Here is what a finished KJ diagram would look like:

An industry example of KJ
As a result of new FDA requirements, a consumer products company needed to produce new nutrition labels for its products.
Currently, it was costing the company over $400,000 per year to be compliant. A team was formed to analyze the process of printing the new labels to see if some of the waste, or muda, could be eliminated.
The KJ method was chosen to try and identify the root cause of the waste. After brainstorming on reasons for waste, the team took the reasons and created an Affinity, or KJ diagram.
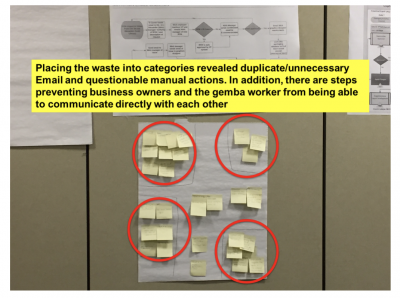
Thanks to the hard work of the team, the entire $400,000 cost was eliminated. The graphic below shows some of the work the team did.
Frequently Asked Questions (FAQ) about KJ
1. What is a KJ diagram?
It is a tool for organizing ideas into themes of similar content after a brainstorming session.
2. What is the difference between a KJ and Affinity Diagram?
None. Since the credit for developing the Affinity Diagram approach is attributed to Jiro Kawakita, it is often referred to as the KJ diagram or method.
3. What is the next step after completing a KJ diagram?
Since the KJ diagram is not a deep dive into possible root causes, the next step is to use the themes and ideas as the foundation for developing a Fishbone Diagram which is a deeper dive into the cause and effect relationship of the ideas.