It is generally easier to understand what your data is telling you if you can visualize it rather than view it in rows and columns of numbers. A frequency plot is a great tool for doing that.
A frequency plot is a graphical representation of the distribution of continuous data based on how often a particular value occurs. A frequency plot allows you to visualize the central tendency, spread or variation, and the shape of your data.
Overview: What is a frequency plot?
When discussing frequency plots, there are four which are mentioned most frequently. They are:
Histogram – a bar graph of the data contained within bins or data ranges of a specific width. It allows you to see the central tendency of the data, the most frequently occurring data, the width and variation of the data, shape of the data, and any outliers.
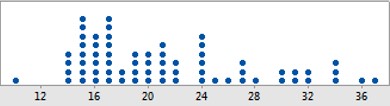
Dot plot – a graphic similar to a histogram which shows the individual data points rather than being compiled within bins. Allows you to see the same data descriptors as a histogram.
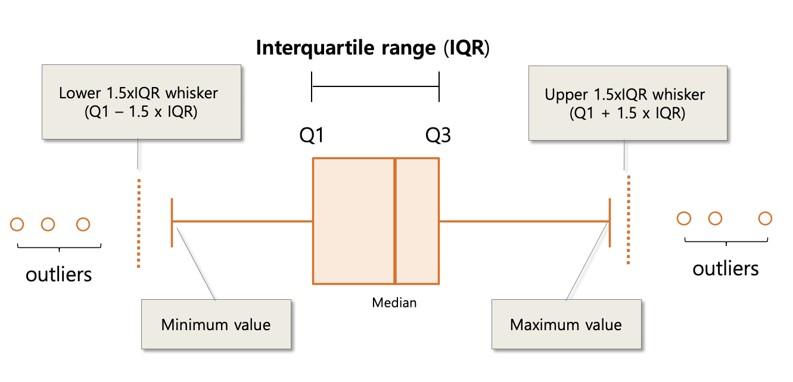
Box plot – in addition to showing the central tendency of the data (usually in the form of the median) this graph also shows the first and third quartiles of the data as well as the width of the data and any outliers. It is very useful when comparing groups of data.
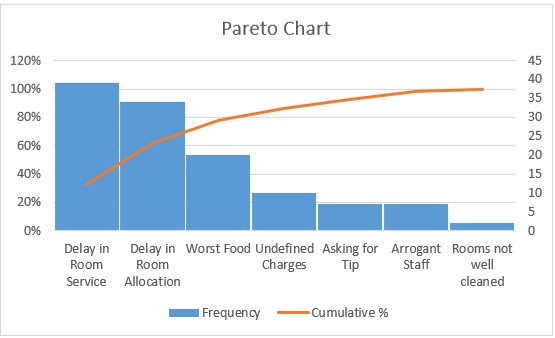
Pareto chart – used when you have discrete data and categories
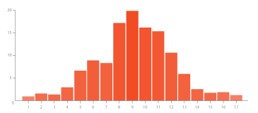
An industry example of a frequency plot
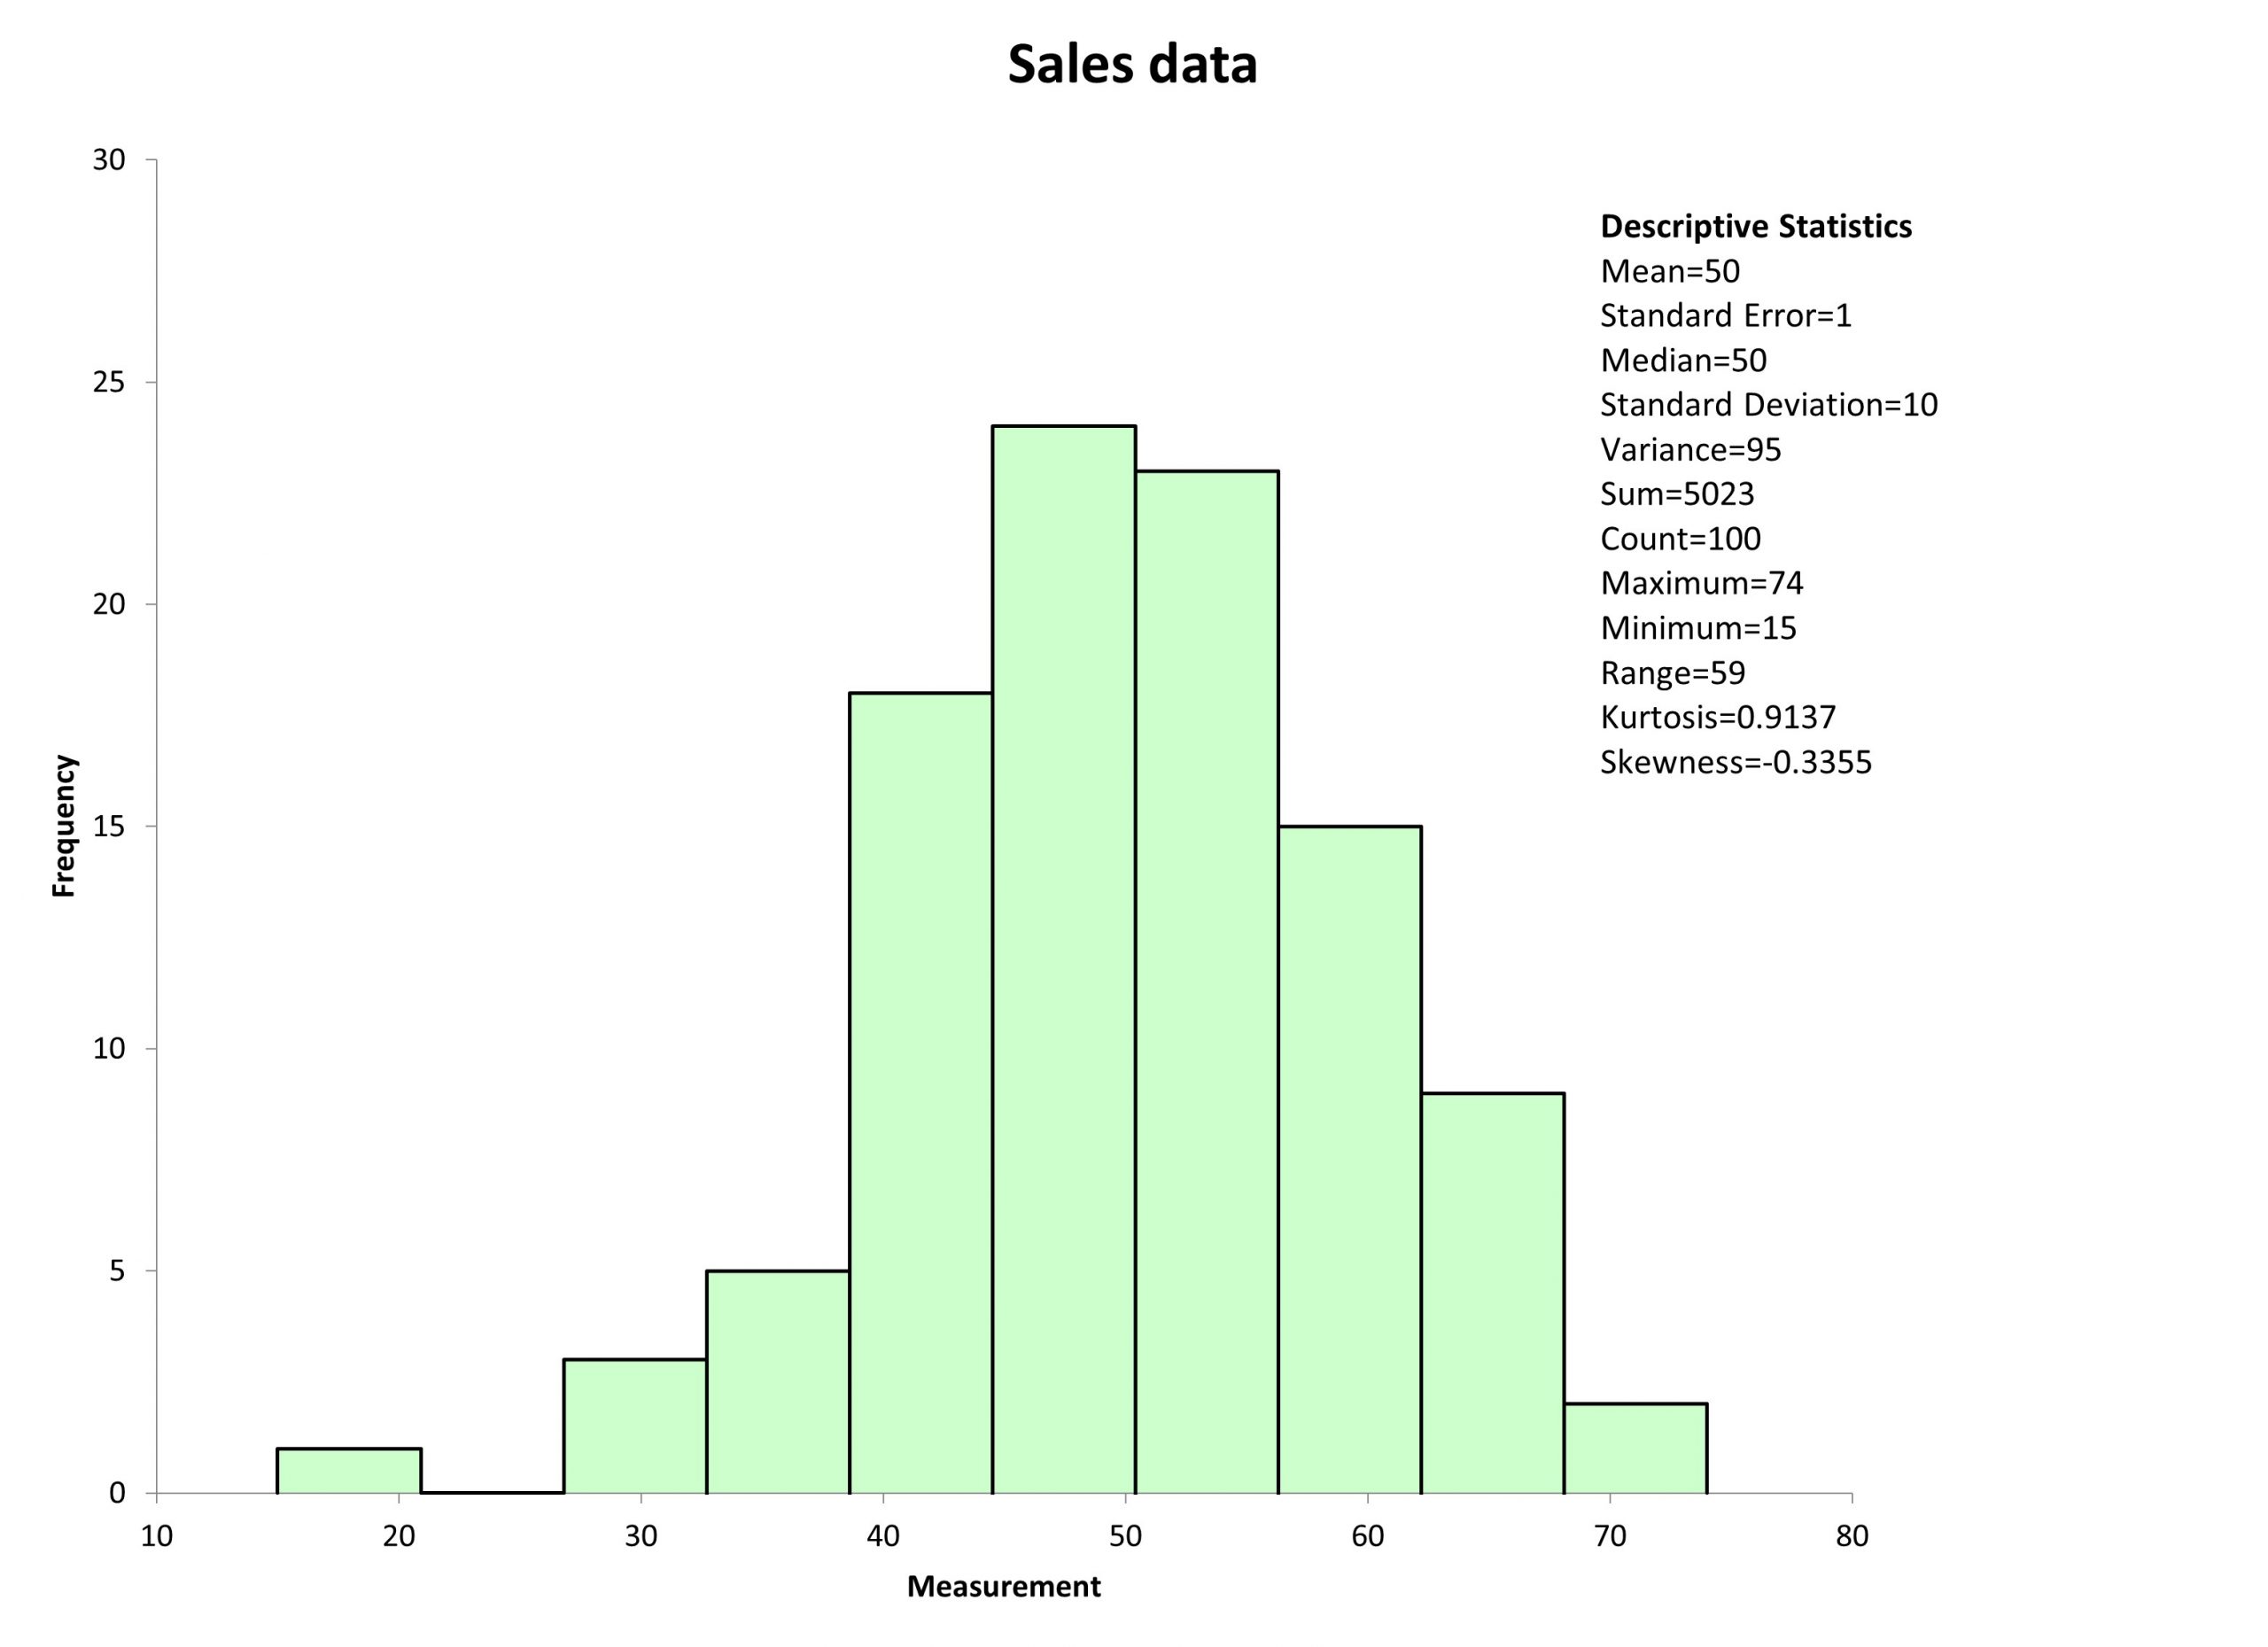
A company was interested in viewing some of their sales data in a visual format. They elected to use a histogram. Below is the output of their data:
Frequently Asked Questions (FAQ) about a frequency plot
What is a frequency plot used for?
It is used to represent your data in a graphical format for easy visualization and interpretation.
What kind of data can I put in a frequency plot?
The most common type of data used in a frequency plot is quantitative or variable data and represents something that is measured or counted.
What are some common frequency plots?
The most common are histograms, dot plots and box plots.