
Let’s look at what correlation means in terms of the relationship between variables. Although our focus will be on positive correlation, we will also describe negative correlation and what we mean when variables do not correlate.
Overview: What Is a Positive Correlation?
First, you want to understand what we mean by correlation. Correlation is a measure of the strength of the relationship between variables. It is referred to as r, or the Pearson Correlation Coefficient.
For example, in simple linear regression, you seek to measure the strength of the relationship between the X, or input variable (predictor variable), and the Y, or output variable (response variable). The Pearson Correlation Coefficient is calculated by the following formula:
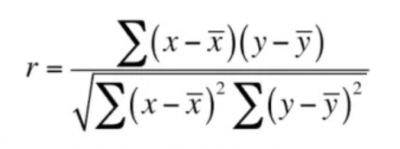
Image source: Pearson Correlation Coefficient
The value of r can range from -1 to +1, with 0 meaning there is no correlation. A value of -1 means there is a perfect negative or inverse correlation between X and Y. As X goes up 1, Y goes down by 1. For example, as altitude goes up, temperature goes down.
Here is what it would look like on a scatter plot. It is not a perfect negative correlation.
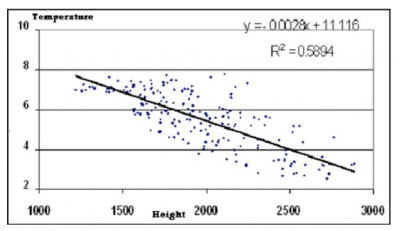
Image source: Correlation between average annual temperature and height
If Y does not show a change as X goes up, then we say there is no correlation, which looks like the graph below. Would you suspect there is a correlation between shoe size and IQ? Doesn’t look like there is.
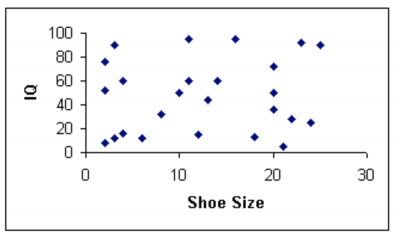
Image source: Correlation between shoe size and IQ
Finally, we have a positive correlation. This relationship is defined as X goes up, and Y goes up. A perfect positive correlation would say as temperature goes up 1 degree, pressure goes up 1 psi.
But, remember the positive correlation can range from any value above 0 to +1. The closer to +1, the stronger the correlation. The scatter plot below is what it would look like.
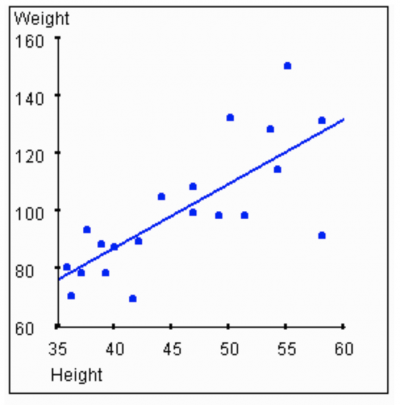
The pattern illustrates as height increases, weight also increases. However, the relatively wide scatter of dots indicates the correlation is not very strong.
The graphic below summarizes the different correlations.
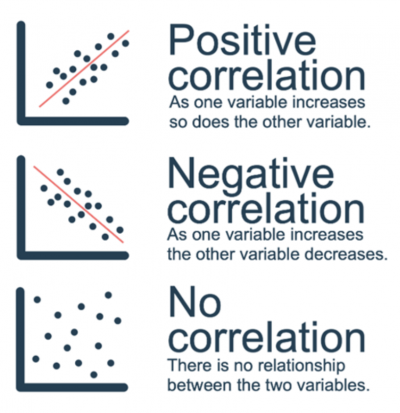
Image source: Positive, negative and no correlation
3 Benefits of Positive Correlation
A positive correlation is not good or bad. It is just a statement about the relationship between variables.
1. Provides Knowledge About the Relationship Between Variables
A positive correlation means as the X variable goes up, the Y variable also goes up.
2. Strength of Relationship
The value of r clarifies the strength of the correlation. The closer to +1, the stronger the relationship, with +1 being a perfect 1 to 1 relationship or correlation.
3. Scatter Plot
The scatter plot is a graphical picture of the correlation between an X and Y variable. The degree of scatter, or density of the cloud, enables you to visually assess the degree of correlation. The calculation of r will give you the statistical degree of correlation.
Why Is Positive Correlation Important to Understand?
A positive r or positive correlation indicates that as your X variable increases, you can expect your Y variable to also increase.
Correlation vs Causation
A positive correlation indicates there is a relationship between your X and Y variables. You cannot conclude that X causes Y. While there might be a positive correlation between shark attacks and ice cream sales at the beach, you cannot state that ice cream sales cause shark attacks. Possibly there is a lurking variable (temperature) that explains why both would be correlated. Higher temperatures might draw more people to the beach, who will buy more ice cream, and at the same time provide more targets for the sharks.
A Positive Correlation Is Not Better Than a Negative Correlation
Correlation is described by two characteristics: direction and strength. Strength is described by the value of r. The sign (+ or -) of r indicates the direction. Whether it is positive or negative is a function of the variables and not a determination of preference.
Correlation vs Regression
Correlation establishes the direction and strength of the relationship between your variables. Regression is used as a predictor of your Y variable as a function of your X variable(s).
An Industry Example of a Positive Correlation
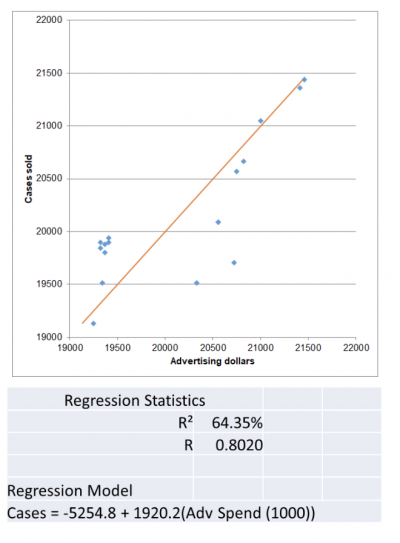
Bridgette, the head of sales, was debating with her Six Sigma Black Belt about the relationship between the money she spends on product advertising and the amount of cases sold. She was convinced more advertising spend resulted in more sales.
The BB did some correlation and showed a relatively strong positive correlation. Note the scatter plot, correlation value, and regression formula the BB provided to Bridgette. Although the scatter plot didn’t appear to show a strong correlation, an r value of +.802 is a pretty strong correlation.
3 Best Practices When Thinking About Positive Correlation
Correlation is a function of the innate relationship between variables. Calculating r is the key to establishing a meaningful correlation. Here are a few tips on doing that.
1. Plot the Data
Plotting your data on a scatter plot is the easiest way to visualize whether a correlation exists between your variables. The pattern of the dots will suggest whether there is a positive or negative correlation, or whether there is no correlation.
2. Use r and r-square to Quantify the Correlation
A positive sign for r will establish a positive correlation. How close your r value is to +1 will tell you the strength of your correlation. Using r-square will tell you what percent of the variation in your Y variable can be explained by the variation in your X variable.
3. Use Computer Software
With all the available software for doing calculations, there is no need to compute r by hand. With the tap of a few keys, you can get your r, r-square, regression formula, and scatter plots.
Frequently Asked Questions (FAQ) About Positive Correlation
Is a Positive Correlation Better Than a Negative Correlation?
No, they just denote different directions of the relationship between your variables. One is not better than the other.
What Are the Possible Values for a Positive Correlation?
Any positive value up to +1.
What Does a Positive Correlation Represent About My Variables?
A positive correlation indicates that as your X variable increases, your Y variable will also increase.
Positive Correlation in a Few Words
A positive correlation between variables means that as one variable increases, the other variable increases as well. The values for a positive correlation will have a positive sign for the calculation of r, with the maximum being +1, a perfect correlation.