
Just as people follow weather predictions to know if they should carry an umbrella, organizations use forecasting to predict and prepare for future events. Across industries, companies attempt to determine what will happen – they forecast for product or raw material prices, market demand, exchange rates, and numerous other key metrics. Based on these forecasts, production sites are built, new products are launched and business entities are re-scaled.
While such forecasts are crucial to making significant business decisions, they may not be as accurate as people think. Organizations often assess the accuracy of forecasts in an elementary way. They monitor, for example, the last available forecast in comparison to the current actual values. Or they may compare the current to the last forecast for a given business quarter.
In his book The Black Swan: The Impact of the Highly Improbable (Random House, 2007), Nassim Nicholas Taleb points out the shortcomings of forecasting in light of the randomness involved in business processes. To address this randomness, practitioners can assess the accuracy of forecasts using control charting and analysis of variance (ANOVA). Screening a corporation’s forecasts with these two tools will reveal the evolution of forecast bias and consistency over time.
Forecasting Basics
In corporations, there are typically two methods for compiling a forecast. In one way, past performance is extrapolated into the future. This approach assumes that the underlying mechanisms remain the same. For example, hotels might forecast their occupancy rate across seasons and plan accordingly for hiring temporary staff. Or, an organization might aggregate multiple individual anticipations of what will happen into one system. For example, predictions from sales agents are consolidated in one database.
To analyze properly the accuracy of forecasts provided by either method, practitioners must understand the following terms:
Forecast horizon describes how far into the future a metric is forecast. For example, weather forecasts typically have a horizon of up to 10 days.
Forecast bias measures how much, on average, forecasts overestimate or underestimate future values. For example, a sales forecast may have a positive (optimistic) or a negative (pessimistic) bias. A positively biased sales forecast, on average, predicts higher sales than what is later achieved. Such a bias can occur when business units get allocated production capacity according to their forecasts and thus have an incentive to be optimistic.
Forecast consistency quantifies the spread of forecasts. People expect a forecast with a short horizon (e.g., the high temperature provided in a one-day weather forecast) to be more consistent than a forecast with a long horizon (high temperature 10 days from now). The reason is that for longer horizons, unknown or non-understood influences typically play a more important role, and the high temperature 10 days ahead may deviate significantly in either direction from what is forecast today.
Forecast bias and consistency are two important elements of forecast accuracy. Notice that bias and consistency are aggregated quantities based on multiple offsets between forecasted and actual values. In other words, they usually are determined using predictions and actual data over a period of time. The offset typically is measured in one of two ways:
1. Forecast – Actual
When a time series, or a sequence of data points, can be considered stationary
2. Forecast – Actual
Actual for a time series with a long-term trend
A prominent example of a long-term trend can be seen in computer memory capacity, which has, over the past 50 years or so, followed a trend first observed by Intel co-founder Gordon Moore. As Moore’s Law predicts, about every two years there is a doubling of the number of transistors that can be placed on an integrated circuit, allowing for a consistent increase in memory.
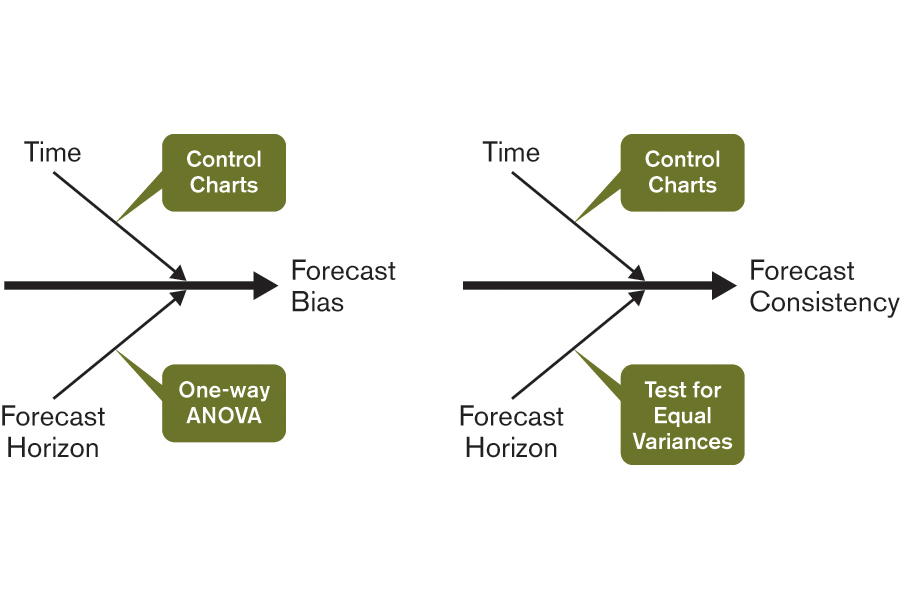
The fishbone diagrams in Figure 1 introduce the two independent parameters, time and forecast horizon, that influence forecast bias and consistency. Also shown are the tools used to analyze them.
Case Study: Forecasting Price of a Subassembly Component
As an example, consider the price forecast data over 20 months of a component used for a subassembly (Figure 2). Price forecasts were made over a horizon of one to six months in advance. For instance, a three-month forecast (3mFC) for the price in Month 9 is actually made in Month 6. This data is derived from a supply-and-demand based model, which considers production capacity to determine future supply and demand, and derive sales prices.
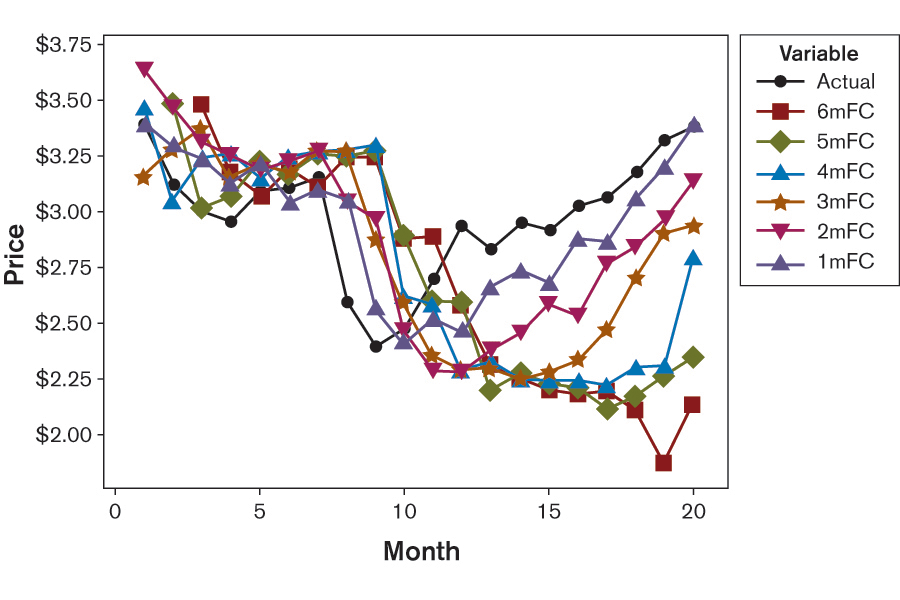
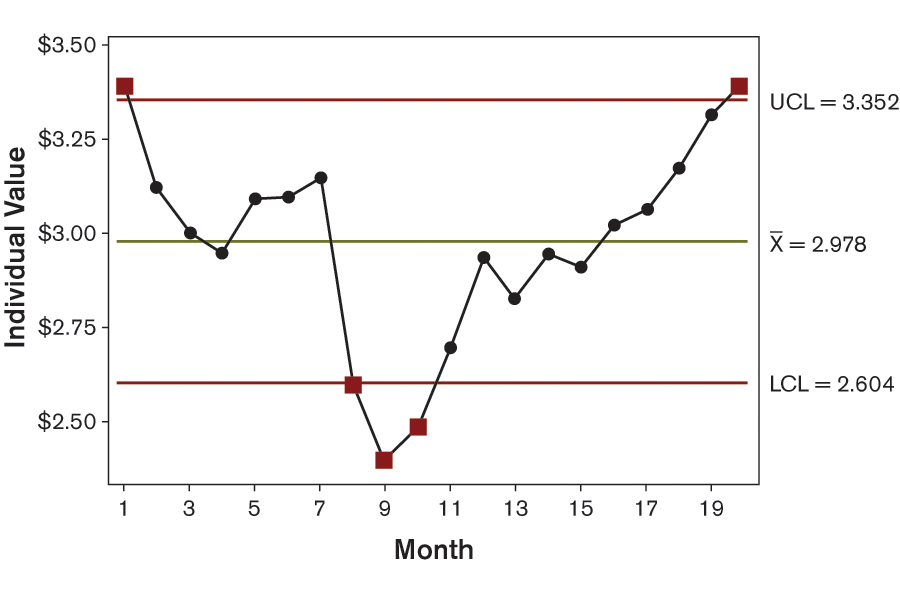
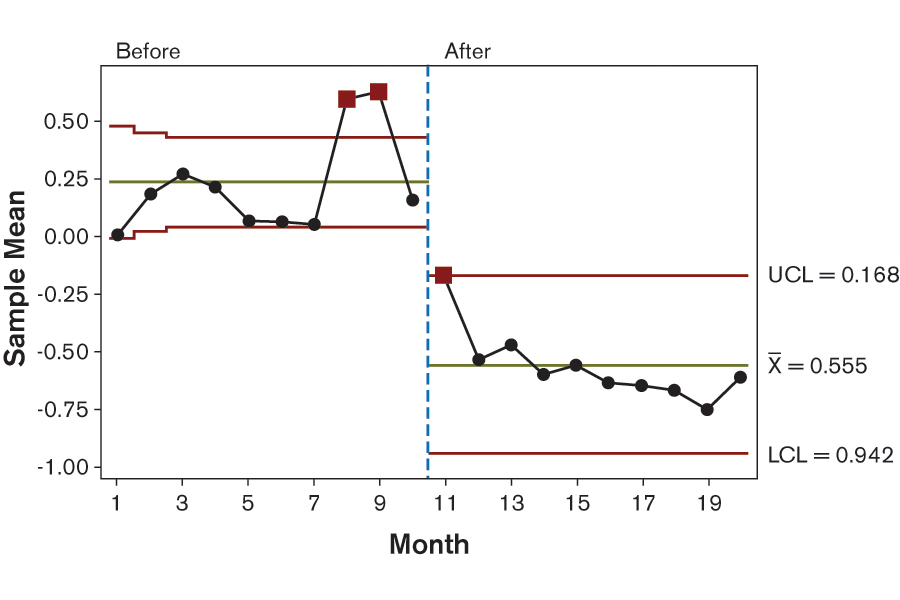
Using control charts, it is possible to confirm that the dip of the actual price from Months 8 through 10 is significant across the time frame explored here (Figure 3). Until Month 10, forecasts are for the most part positively biased, whereas later they display a significant negative bias (Figure 4). In Figure 4, the time section “Before” the dip displays a lower control limit of about zero, which means that the average of forecasts minus actuals is significantly larger than zero, and thus positively biased. For the time section “After” the dip, the upper control limit is about zero, which shows that forecasts are now negatively biased.
The relation of the price forecasts to the actual price of the component can be understood from a business context. The company’s purchasing and production departments celebrated the price reduction after Month 8 as a permanent breakthrough, and simply brushed off the idea of prices regaining their previous levels. Forecasters, who received most of their information from the purchasing department, were thus induced to adapt parameters in their models according to this general belief.
Unfortunately, such occurrences appear to be commonplace; because a “think positive” attitude is often rewarded in the corporate world, experts with an understanding of complex market mechanisms may be listened to too late. To avoid this, organizations should ask the experts to quantify the likelihood of the perceived risk, assess its potential impact and prepare a contingency plan accordingly.
Setting the Time Period
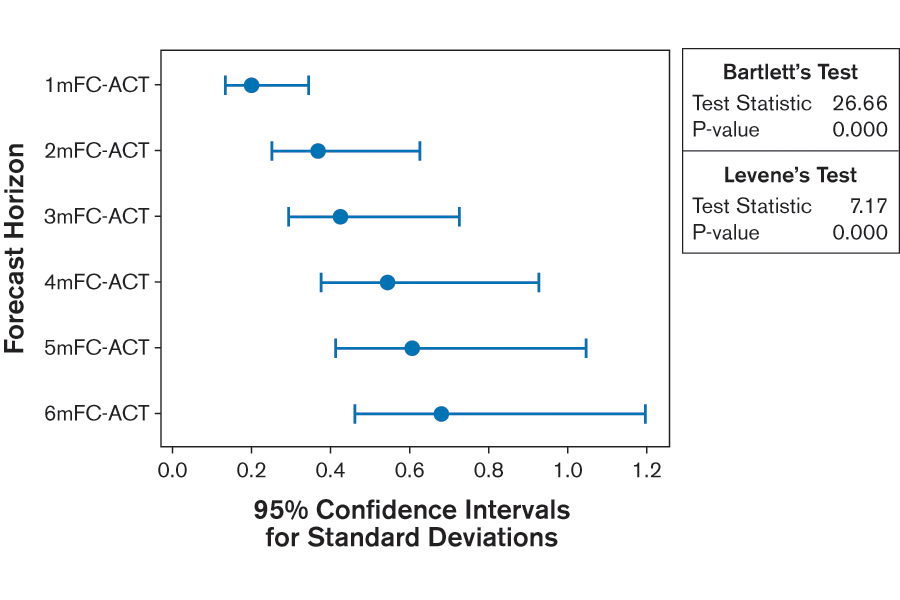
Is a one-month forecast any better than a six-month forecast? Translated into mathematical terms, this question is asking: “Do one-month forecasts spread around the actual values significantly less than six-month forecasts?” Using the forecast-minus-actual metric, practitioners can perform an ANOVA test for equal variances to answer this question. For the data above, when the time frame of the studied 20 months is considered, forecast bias does not significantly depend on the forecast horizon (Figure 5). The dots indicate the standard deviations and the lines their 95 percent confidence intervals.
Determining Confidence Limits
The analysis of the forecast-minus-actual price data can be used to estimate forecast confidence limits based on past forecast performance. Assuming that the forecast process delivers results with the same performance as before, consistency (Figure 6) and bias (found not to be significantly different from zero) from the previous ANOVA assessment can be used to display confidence limits around the forecasted values.
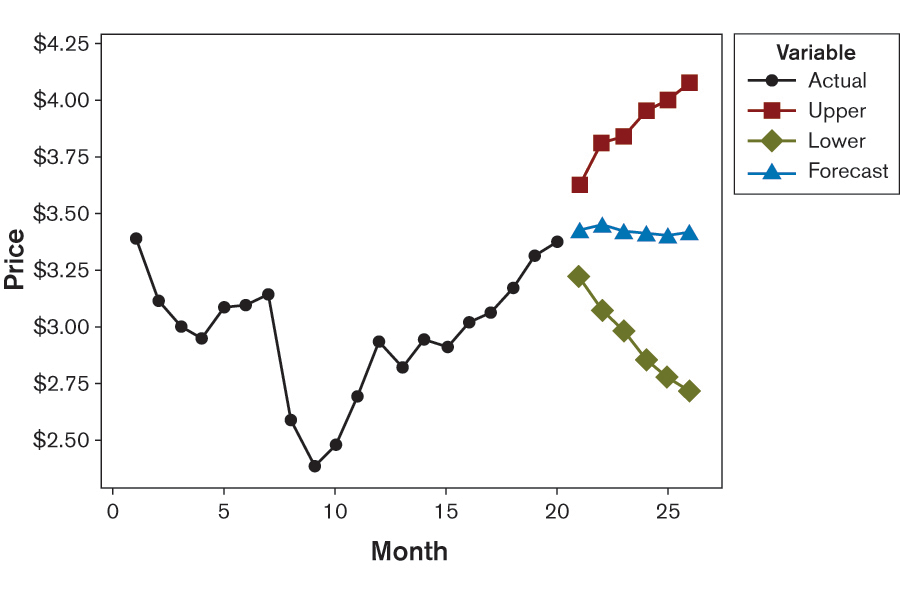
There is a roughly 30 percent chance that the actual price values will land outside these 1-sigma confidence limits (15.9 percent chance for a value above the upper 1-sigma confidence limit and 15.9 percent for a value below the lower 1-sigma confidence limit). Typically, decisions are based on a 95 percent or higher confidence interval with far wider limits; here, only a 70 percent confidence interval is considered. The price three months in the future could either be at $3.90 or at $2.90, with a 30 percent chance it would be beyond these two values. The actions that would need to be taken for either of the two cases are of a completely different nature.
From the practical point of view for managing the subassembly business, forecasts with such accuracy at this confidence level are considered virtually worthless. A useful forecast is one in which the upper and lower confidence limits, at a reasonably high confidence level, lead to about the same practical consequence.
Considering Models
While a supply-and-demand-based model of forecasting is applied in the case study example, there are many potential forecasting models. The more elaborate a model, the more the forecasts of such models tend to be taken for granted. The methods discussed in this article can gauge the validity of forecasts at any level of sophistication.
Addressing Inaccurate Forecasts
Faced with a forecast that does not provide useful data, a team is left with two alternatives:
1. Significantly improve the forecasting process and its accuracy
2. Improve the reaction time of the process such that less forecast accuracy is needed
The impossibility of the first in many business contexts led Taleb to write that “we simply cannot forecast.” But not forecasting is not an option in today’s business world. Because of the resulting necessity of the second alternative, Six Sigma teams may find forecasting accuracy a tremendous source for improvement projects. For example, if a product mix forecast is inaccurate, a Six Sigma team could launch a project to reduce lead times in order to improve reaction time to changing demands. Or, if forecasts for product and raw material prices are inaccurate, a team could lead a project to decrease waste in the supply chain. As Taleb describes eloquently, the hardest part may not be to assess the accuracy of forecasts but rather to make the results generally accepted throughout the organization and to translate them into a consistent approach for improving and managing business processes.