
Key Points
- Maturity assessments allow an organization to see the progress of anything within the confines of the company.
- It uses a quantitative system to allow for hard data to be gathered regarding the assessment.
- Any organization should run maturity assessments regularly as a health check for processes, production, or even the organization itself.
When an organization begins a Lean Six Sigma deployment, what is the first step that the leadership team should take? Should they start executing Kaizen events to demonstrate the impact of quick process improvement? Or should they kick off with Six Sigma projects, using the DMAIC or DFSS roadmap, with a deep dive into sophisticated statistics?
While these two efforts can bring value in time, ideally leaders should start with a Lean Six Sigma maturity assessment – a self-evaluation of where the organization stands. The key to successful implementation of Lean Six Sigma lies in knowing where the organization needs to be in the future.
At the same time, it is equally important that leaders know the current state of their business. A Lean Six Sigma maturity assessment shows leaders how advanced their organization is in terms of the Lean Six Sigma perspective, its strengths, weaknesses, and improvement opportunities.
The assessment enables detailed, step-by-step, quantitative scoring to diagnose the current state. The rigorous nature of this exercise ensures that the journey going forward will lead the organization toward a future state of satisfying customer needs, improving internal processes, motivating employees, and keeping the balance sheet strong.
Why Conduct a Maturity Assessment?

Periodic health checks are a part of life for any person. You go in for checkups, testing, and so forth. The same applies to your organization. If you’re doing anything, you’ll want to conduct maturity assessments regularly. This gives you the means of seeing how things are performing, and you get hard data to back it up.
The 3A Approach: Assess, Analyze, and Address
A Lean Six Sigma maturity assessment should follow a three-phase approach: 1) assess, 2) analyze, and 3) address. The tasks within each phase are described below.
Assess
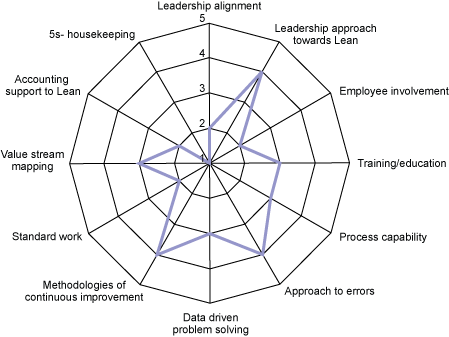
The assessment phase involves the use of a scorecard of Lean Six Sigma parameters and a radar chart, also known as a web chart or spider chart. The scorecard should be completed by both the leaders of the Lean Six Sigma deployment and the department heads for each of the individual verticals within the organization. The scorecard (seen in the table below) should address these 12 Lean Six Sigma parameters:
- Leadership alignment
- Leadership approach toward Lean Six Sigma
- Employee involvement
- Training
- Process capability
- Approach to errors
- Data-driven problem solving
- Continuous improvement methodologies
- Standard work
- Value stream mapping
- Accounting support to Lean Six Sigma
- 5S/housekeeping
A 1-to-5 rating scale is used to assess the selected Lean Six Sigma parameters, where 1 represents the lowest level of maturity and 5 is the best in class. The scorecard contains detailed guidelines for scoring criteria.
Sample Lean Maturity Assessment Scorecard
| Parameters | 1 | 2 | 3 | 4 | 5 | Score (1-5) |
| Leadership alignment | No leadership alignment for process improvements | Leadership is somewhat aligned with process improvements, but visible and active selection and review of projects are not in place. No trained and committed resources available to support projects | Leadership aligned with process improvements, visible and active selection, and review of projects. No resources available to support projects | Leadership is aligned with vital metrics, visible selection, and review of projects. Some trained resources are available | Trained and committed resources supporting projects | |
| Leadership approach toward Lean | Company executives demonstrate no understanding of the Lean approach | Executives demonstrate an understanding of the Lean approach | Executives demonstrate an understanding of Lean but do not have full faith | Executives demonstrate good understanding and have faith in Lean. Leadership committed but not prepared for accelerated biz improvement | Sr. execs have full understanding and faith in Lean; leadership prepared for accelerated biz improvement | |
| Employee involvement | Little or no involvement of people in process improvements | Involvement of people in process improvements to some extent and people are eager to work in teams | People form cross-functional teams whenever a problem arises | Quality improvement, problem-solving, and corrective action teams are in place. 25 to 50% of employees involved in teams | 50% or more involved in teams; open access to top management; empowered to stop the process for quality | |
| Training/ Education | No training on Lean tools or quality improvement tools, methodologies or even concepts | Few team members have heard about different concepts of improvement methodology but not formally trained | Team members are trained in some basic concepts like 5S, Lean overview, 7 QC tools | Team members have good understanding of process improvement methodologies | More than 5% of employee time devoted to training and implementing improvements | |
| Process capability | The area of assessment has a sigma level less than or equal to 1, for its most critical process. Cpk is less than or equal to 0.33 | The area has sigma level greater than 1 but less than or equal to 2. Cpk lies between 0.33 and 0.66 | The area has a sigma level greater than 2 but less than or equal to 4. Cpk lies between 0.66 and 1.33 | The area has a sigma level greater than 4 but less than 6. Cpk lies between 1.33 and 2 | The area has a sigma level greater than or equal to 6. Cpk is greater than or equal to 2 | |
| Approach to errors | Errors will happen; inspect them out; accept cost of scrap and rework; deal with customer complaints | Although errors happen but some initial thought prevails to implement or design error-free systems using Lean | Inspection and control only; some data collection to regulate variance | Inspection, control and improvement; data collected to regulate variance | Zero-defect quality mindset | |
| Data-driven problem-solving | Insufficient data available for key processes needing improvement | The organization does not use data-driven problem-solving methods to a great extent. Data collection processes are not systematic and in place | Org uses data driven problem solving methods. Data collection is systematic and efficient, although MSA not done extensively | MSA is done extensively and people know the tools needed to analyze data | Org uses data-driven problem-solving methods across the spectrum | |
| Methodologies of continuous improvement (CI) | No formalized improvement methods exist. No evidence of employees, or managers concerned about CI | Improvements reactive – usually come from management, engineering, supervision, or when a customer complaint is received. Some training started in problem solving | Some improvement methodology is evident; teams are sometimes used to develop solutions. CI training supported by management | CI used to advance the company. All associates are trained. Open documentation and dashboards used to track improvements tied to dollar savings | Methods such as PDCA are known and used by all employees; CI is part of company culture | |
| Standard work | No standard work procedures exist. No understanding of the connection between CI and work standards | Some standard work procedures exist to show how the process is made, materials flow and administrative processes function but are not current nor displayed. Thinking of internal customers begins | All standard work procedures can be seen in most areas. Process owners know the what, when, where, why and how of their areas. Ownership taken to use standards and keep them current | Standard work procedures are current and posted in appropriate areas | Employees have quick and free access to all standard work. CI to operations reflected in procedures | |
| Value stream mapping | No process is mapped according to the value stream | An understanding of VSM is evident. Some attempts have been made to map a simple process | Several people have been trained in VSM, and some processes mapped. No improvements | Most understand the value of VSM. Mapping has uncovered opportunities for improvement. Action plans are in place. Rapid improvement blitzes preceded by VSM | Most processes mapped with results of action plans recorded | |
| Accounting support to Lean | The accounting system provides basic financial data based on cost accounting. There is little awareness of accounting’s role in support Lean initiatives | There is an awareness that accounting has a role in Lean. Some staff has been trained and initial analysis has been undertaken | All key staff have been trained. The pilot project has begun; the department targeting waste in its processes | Key value streams are using Lean. Decisions are being made using Lean financial data. Some initial investigation to review current standard cost methods | Accounting system provides financial data based on measurements at the value stream level and provide support for Lean | |
| 5S/House-keeping | Disruptive and messy, no formal workplace organization standard in place. No order, area untidy, materials have multiple locations | Company aware of 5S principles but no training underway. Non-routine cleaning takes place | Most areas have begun 5S. Materials have permanent positions, cleaning schedule is followed. Teams investigate the root causes of the disorder. Employees participate, support, understand and do most cleaning | Audit teams assess 5S standards. All areas working on standardizing processes. Evidence of employee pride | Clean, orderly, self-maintained; always “tour ready” |
To aid in completing the scorecard, leaders should conduct interviews and audits, walk the shop floor, and do all other necessary data gathering. Once the scores are complete, they can be transferred to a radar chart, which helps leaders see the current state in a graphic form. The chart illustrates the 1 through 5 rankings for the different Lean Six Sigma parameters; the lower the Lean Six Sigma maturity level, the closer the scores are toward the center of the chart.
Analyze
Once the Lean Six Sigma deployment leader receives the completed scorecards and linked radar charts from the leaders of the various verticals in the organization, the analysis phase can begin. The goal of the analysis phase is to identify the most important parameters on which to start working.
To do this, the deployment leader can start by creating a graph comparing the scores for the individual parameters to the organization’s Lean Six Sigma maturity index (the average of all those scores).
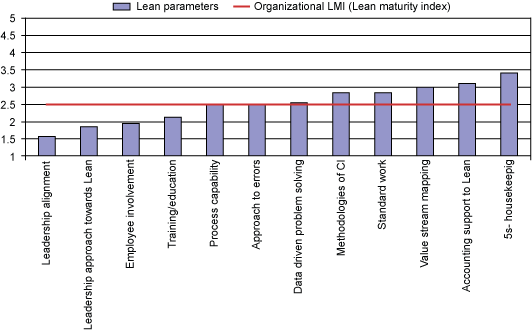
The bars on the left side of the graph represent the weaknesses of the organization. Because these parameters achieved lower scores they are a matter of concern and need immediate attention. The parameters on the right-hand side are those with the highest scores, making them strengths. The difference between the Lean Six Sigma maturity index and the desired score of 5 is known as the maturity gap.
Once the key parameters for improvement are agreed upon, based on this gap analysis, the second phase is complete.
Address
In this last phase, leaders from the various departments and functions within the organization should meet to address the weaknesses. One way to collect ideas for improving these areas is to use the brainwriting technique.
This technique differs from traditional brainstorming in that participants write down their ideas rather than immediately share them aloud. After the broad action ideas are compiled, the group can drill them down using a decision tree diagram. All attainable action items should be slotted into a Gantt chart to form the improvement roadmap.
Once the whole cycle of assessing, analyzing, and addressing is completed, leaders can look back on lessons learned and prepare for the next cycle of the continuous improvement journey.
Other Useful Tools and Concepts
Looking for some extra information? Learning the differences between DFSS and DMAIC can make for effective products that are delivered with quality in mind. Our guide on the subject covers the differences between these methodologies and how to use them.
Additionally, if you’re looking for the means to problem solve, then writing a good problem statement is the first step. It isn’t enough to identify the problem, you have to get to the root of the issue before you can treat the rest of the symptoms.