Performance improvement leaders have a multitude of tools and methods available for problem solving. One key to success is knowing what tool to use in a given situation. At the start of the COVID-19 pandemic, a RACI (responsible, accountable, consulted, informed) diagram and swimlane process map supported rapid process development.
The problem: Healthcare providers needed to safely care for patients over the course of the pandemic.
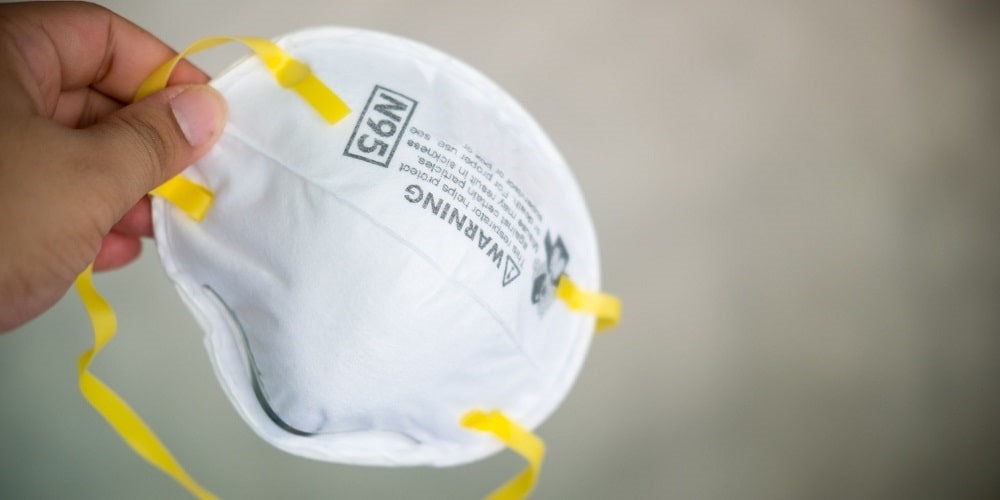
Healthcare supply chains were scrambling to find alternative sources of personal protective equipment (PPE). It quickly became apparent that supplies would not be replenished with the quality or quantity needed. Single-use items were particularly problematic. One academic medical center’s focus was on N95 respirator masks. How could N95 availability be extended? This was a problem that quickly needed a solution. After researching a number of alternatives, organizational leaders made the decision to move forward using hydrogen peroxide vapor to decontaminate N95 respirator masks.
The U.S. Food and Drug Administration (FDA) had sanctioned an Emergency Use Authorization (EUA) to use hydrogen peroxide vapor technology to decontaminate N95 respirators for reuse by healthcare personnel. Decontamination of N95s would allow this single-use item to be used multiple times. The academic medical center formed a team to develop and roll out the process to the health system led by a Lean Six Sigma Black Belt who was familiar with the technology. She had led a previous project where this technology had been implemented to disinfect patient rooms. The N95 Reprocessing Project began with the team drafting a charter with the following goals:
- Increase availability of N95 masks x 1900 percent (use a reprocessed mask 20 times instead of once)
- 100 percent of N95s safe to use
One problem was immediately obvious – accountability. There was no clear hierarchy of ownership for the tasks necessary for this work. A RACI diagram would be the perfect tool to address this issue. The purpose of the RACI is to clearly identify the roles and responsibilities of team members and/or stakeholders pertaining to specific tasks. It clears up confusion over ownership.
RACI stands for responsible, accountable, consulted, informed. The operational definitions of those terms are:
- Responsible: Performs the work
- Accountable: Accountable for making sure the work gets done
- Consulted: Has information necessary to do the work
- Informed: Notified when the work is complete
In creating the RACI, the team leader pre-populated tasks and team member names on the diagram. She recorded the appropriate letter (R, A, C or I) for each task in her column, denoting that she was either responsible, accountable, consulted, or informed for each task. The remainder of the RACI was completed during a team meeting. At the meeting, executive sponsors spoke to the importance and priority of the project. This facilitated input and discussion for accountability and responsibility.
The following are key factors in creating a RACI:
- It is vital to have executive sponsors in the room to gain agreement from team members on the Responsible and Accountable assignments.
- Sponsors should clarify priority for the work.
- Use detail to clarify tasks.
- Ask assigned Accountable people if they have additional resource needs.
- There is usually one person Accountable for each task, but there may be multiple people Responsible for completing the work.
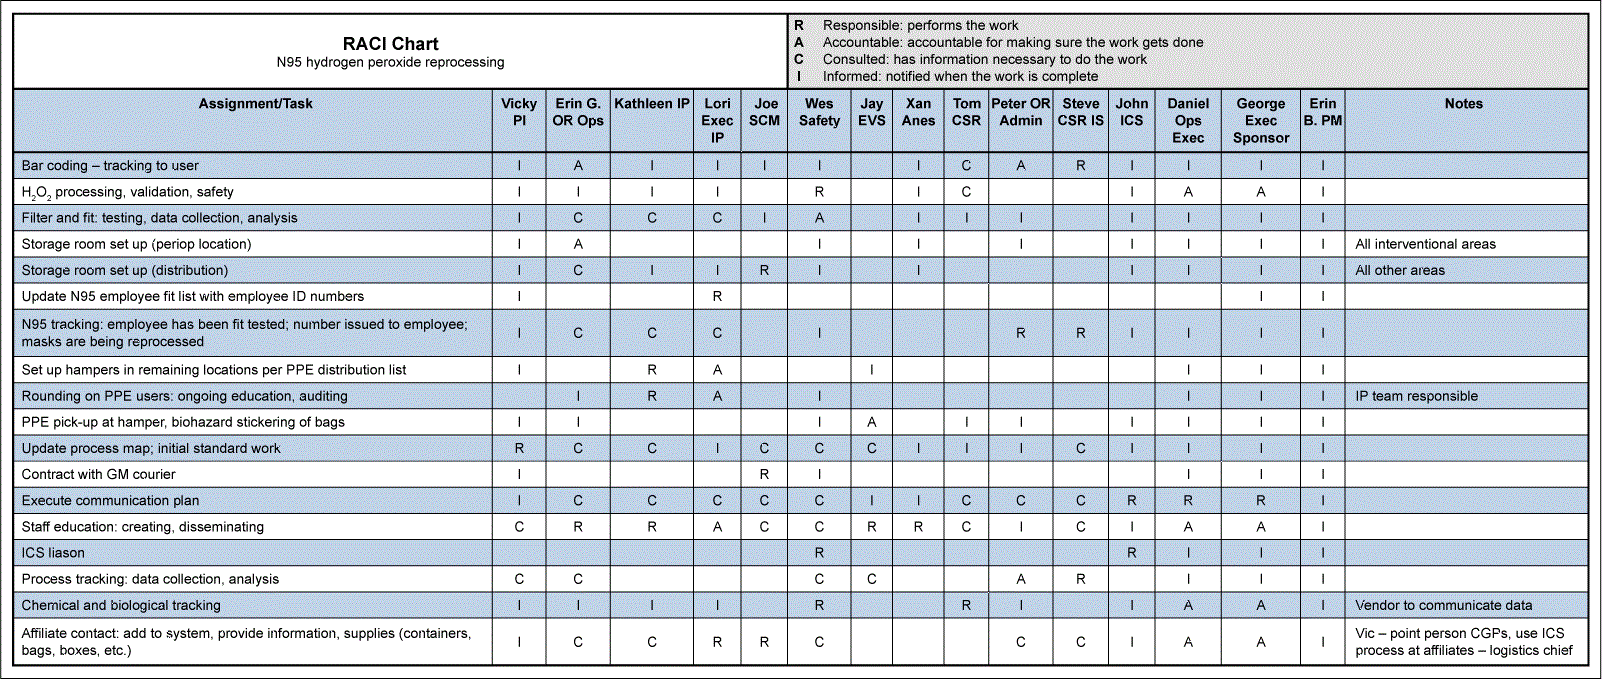
A number of issues can be solved by using a RACI:
- Clarifies understanding of ownership/roles, puts everyone on the same page
- Clarifies task specific communication across the team – who to consult and inform
- Makes task-specific follow-up and questioning straightforward
- Accountability and Responsibility expedite tasks being completed
Once the team was clear on ownership, they focused on developing the process. Information about COVID-19 was rapidly evolving, and at times it was difficult keeping current from one hour to the next. Communication was constant and everyone was under stress – especially those involved in direct patient care. The team leader knew from experience that as process steps were developed and tested, documentation would be essential. Creating a process map would enable visual communication and rapid updating as information changed. It would clearly communicate the order of steps, detail for steps and where the process flow split due to a decision. It would also be easy to create during virtual meetings; due to the concerns about coronavirus transmission, the team would no longer be meeting in person.
A process map is a detailed illustration of the process flow. It’s a flowchart that visually depicts the process steps in order, decision points in the process and handoffs between roles or departments. It helps people to see where waste is or could occur in the process (loopbacks caused by defects, delays that increase process time, overproduction that wastes resources, unnecessary steps, etc.). This tool was used to visually capture the process steps in detail, as they were developed. This was a complex process involving multiple roles and departments. To address the complexity, the leader decided to use a swimlane process map, which additionally illustrates the handoffs and dependencies in the process. Each lane on the map is assigned to a role, group or department, and the steps that fall in that lane are their responsibility.
Mapping N95 reprocessing was an iterative process. Steps were documented directly on the map during virtual meetings. The team discussed what should happen in the process and changes that were made after testing steps. Because there was an immediate need to have this process in place, small, informal, PDSA (plan, do, study, act) cycles were used to test and refine steps. PDSA cycles are experiments – small tests of change. An idea is tested, measured and either refined, implemented or abandoned based on the outcome of the experiment. After each PDSA cycle and/or team meeting, the map was reviewed for accuracy. Clouds were added for questions that came up as the map was critically reviewed. Once presentable (it was messy capturing all of this during meetings), the newest version was sent to the team for feedback and testing – usually within hours after each change.
Figure 2 shows the first draft of the process map. The process steps were captured on one page as much as possible to facilitate team viewing virtually.
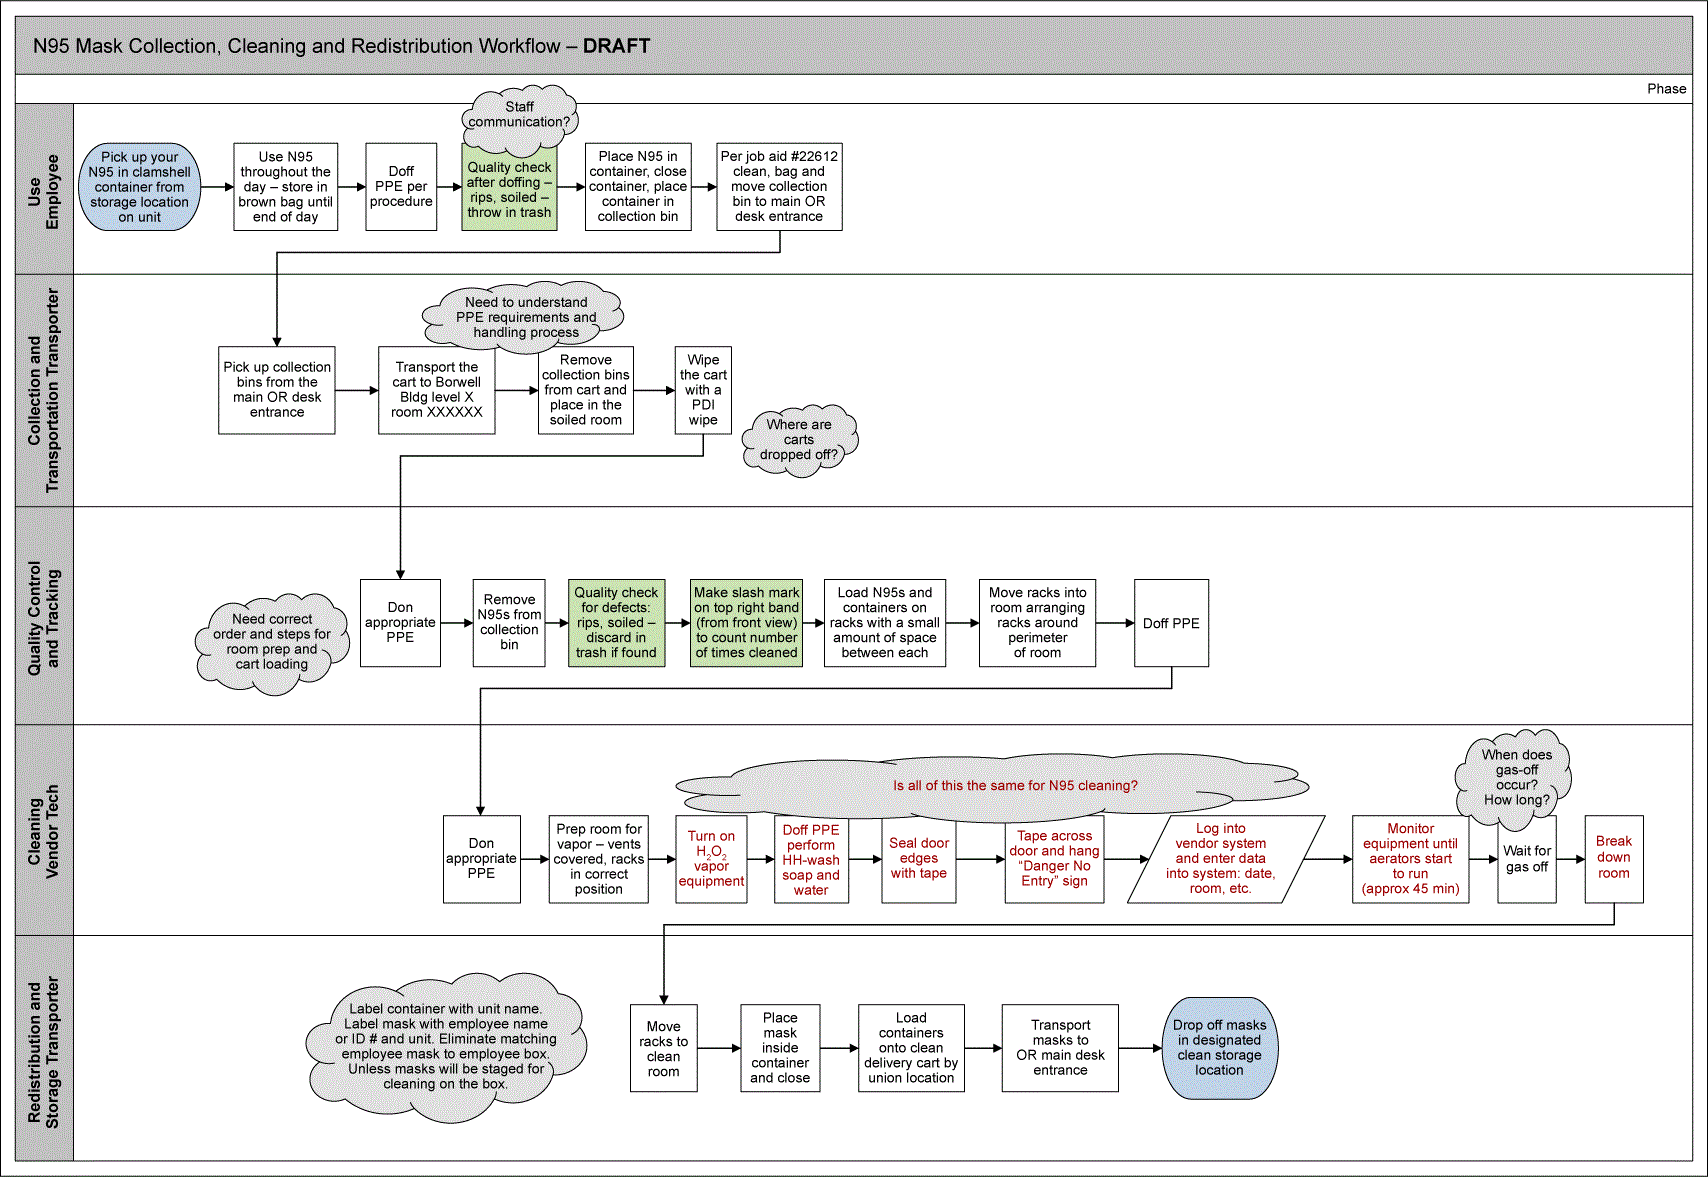
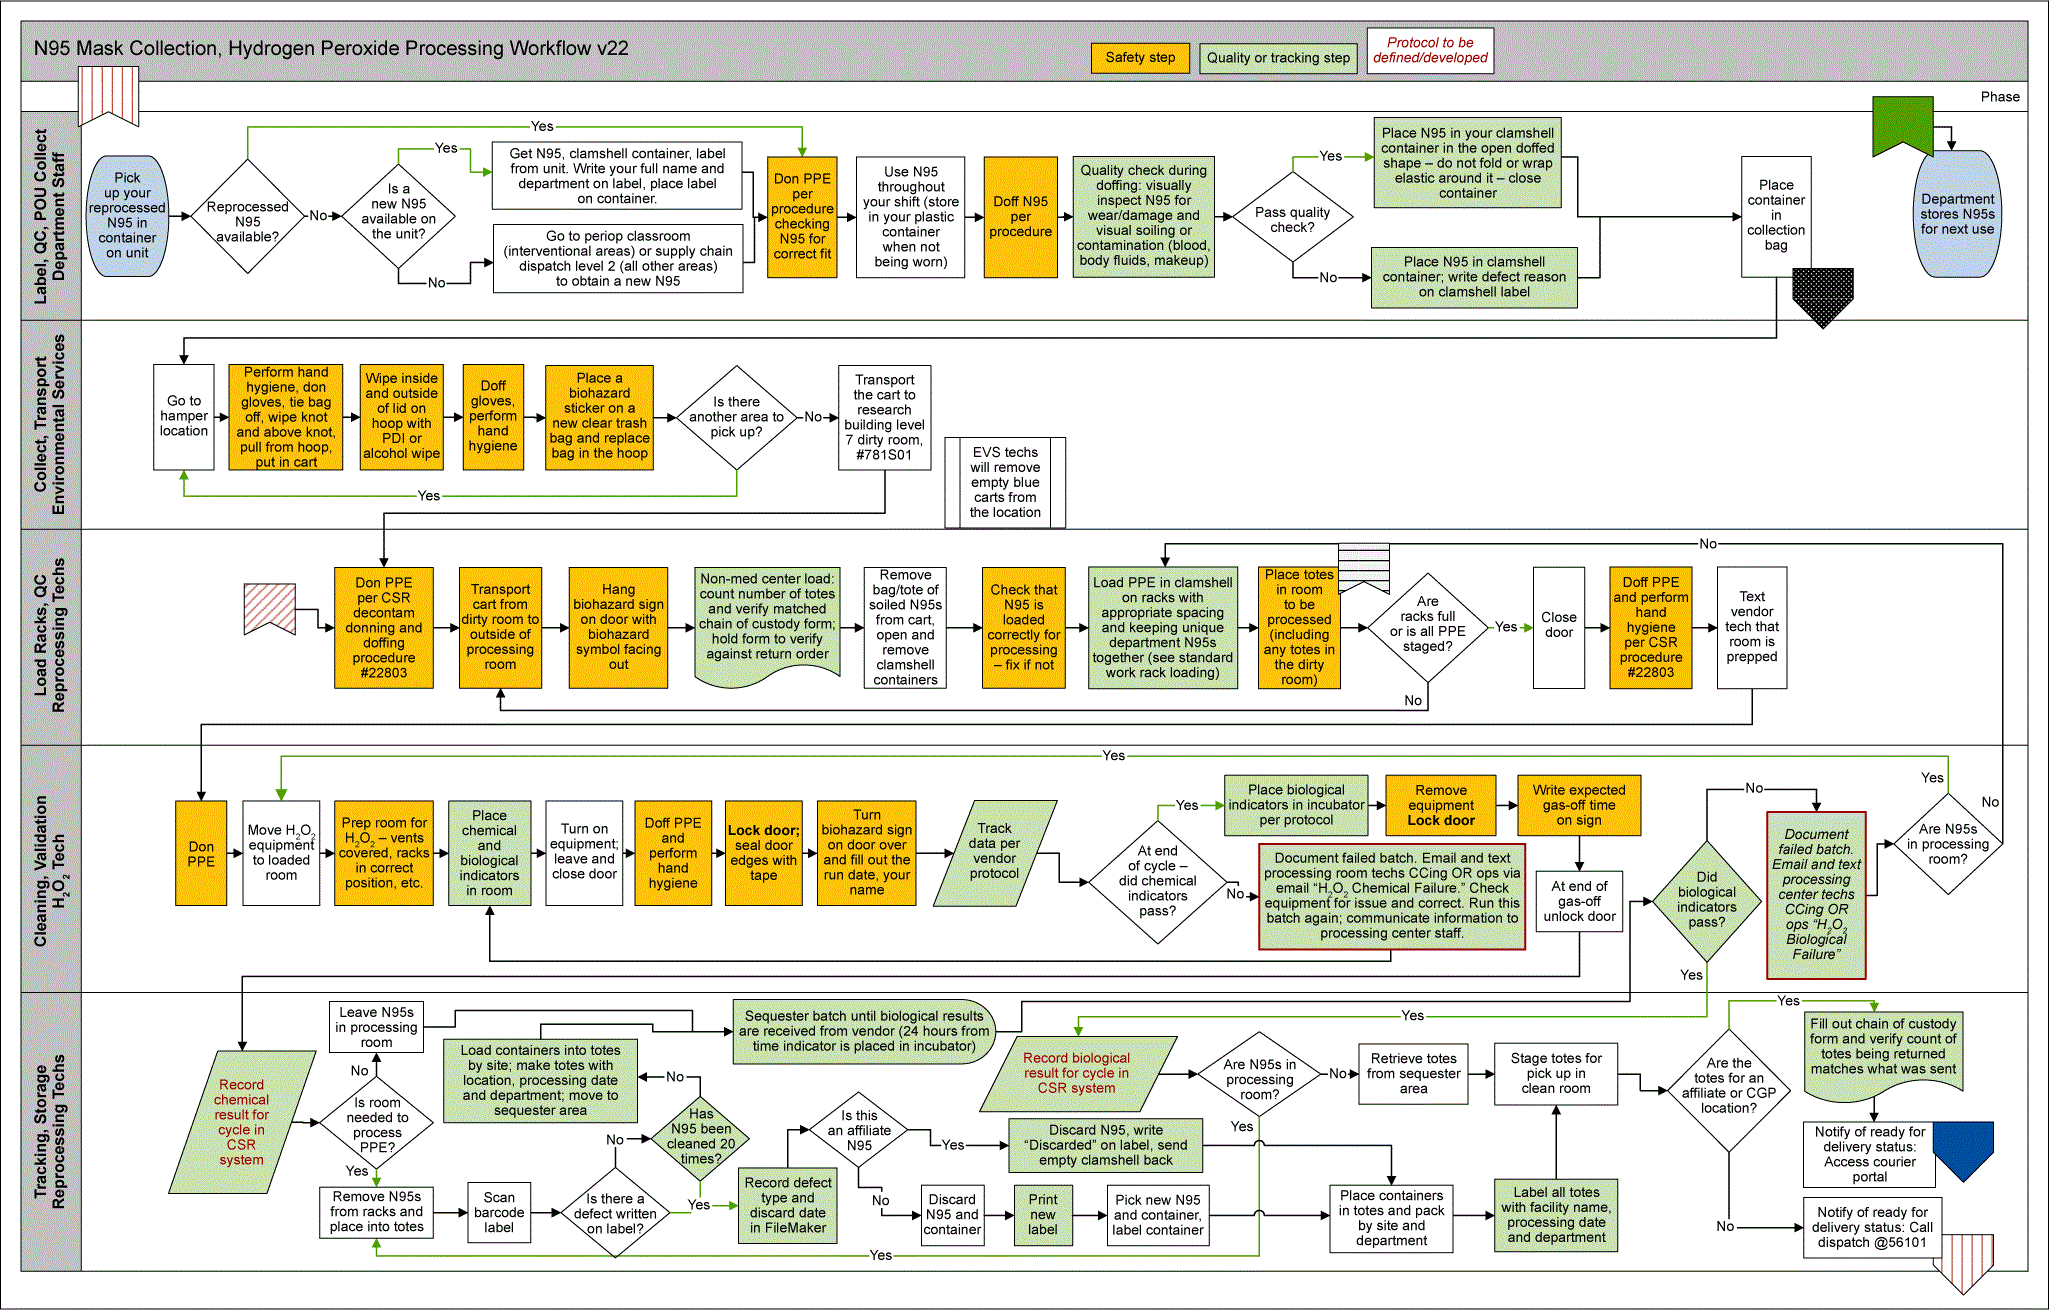
Figure 3 shows details of the draft process map.

There are some key points to remember when creating and using a process map:
- Include details of each step so that everyone on the team understands each step and how they link together.
- Use a cloud symbol to record places where more information is needed. In this example, these places included how established procedures would integrate with the new process, technical info needing clarification, where customer input was needed as well as items needing testing and refinement.
- Use color coding to aid in visual identification of safety and quality steps as well as protocols that need to be defined and developed.
- Grouping of similar/related steps per page helps to define focus to a particular part of the process. For instance, on page one the steps for collection and reprocessing were captured, on other pages acquisition, distribution, reporting and tracking.
- Use on- and off-page connectors to link steps on different pages.
- Implement version control to keep a documented record of the development and changes made. (Archive old versions for reference.)
The benefits of using the swimlane in process development include:
- Provides documentation for all stakeholder groups in real time as the process is developed and changes are made
- Aids critical thinking about specific steps, potential defects, waste and linkages between steps
- Simplifies understanding of where quality and safety checks are needed
- Is the source of truth for the process
- Documents current state of a complex process
- Facilitates agreement of steps in the process through visual communication in addition to team conversation
- Helps to standardize the process across different end user groups
- Useful for communicating and training staff
The first team meeting was held was on April 14, 2020, and the team ran the first official reprocessing cycle on April 27, 2020. They had a solid, documented, process for collection, reprocessing and distribution by May 7. They continued adding and refining process steps through July. Version 22 of the map from “collection of soiled N95s” to “staged for distribution” steps of the process is shown below. There are four additional pages (not displayed in this article) that encompass the entire process.
Let’s revisit our initial project goals:
- Increase availability of N95 masks x 1900 percent
Outcome: Most masks failed before 19 cycles. They were reprocessed until failure or 19 cycles – whichever came first.
- 100 percent of N95s safe to use
Outcome: Masks were filter- and fit-tested to ensure safety.
This project demonstrated that with strong sponsor support – and by using the right tools – teams can quickly create and roll out a new process using technology in an entirely new way. The RACI diagram is a tool that should be used regularly with project teams. Its benefits far outweigh the time and energy to complete it, including helping executive sponsors understand potential issues that may arise during the project.
During the N95 reprocessing project, it was especially useful to ask questions of – and follow up with – the right people. Process mapping is a familiar tool used in many improvement projects. In this case it was invaluable for driving the design process, tracking changes, communicating current state at any time and training staff. Together, these tools drove the project team to success.
Reprocessing of N95s continued for nearly a year. During that time 56,038 N95s were reprocessed, avoiding the use of 38,175 N95s. At the pandemic’s peak, between 500 and 700 N95s were being reprocessed on a given day. Most went through two-to-three reprocessing cycles before they were no longer usable, but quite a few lasted much longer. Reprocessing allowed more than 3,900 providers to safely treat their patients during a time of unprecedented challenges in healthcare. Safe patient care means both patients and staff are safe. It is the number one priority for everyone working in healthcare every day.