
During the last five years, Ephrata Community Hospital in Ephrata, Pennsylvania, USA, has seen laboratory volumes increase by 13.5 percent annually. That resulted in the hospital expanding its lab into a new facility in 2004. Yet despite the new facility, a big challenge remained – meeting the goal of a 60-minute turnaround time for all stat labs. This was one of the main reasons the lab management team chose to learn to use the Lean methodology to improve its lab processes.
Current State Mapping Using Lean Tools
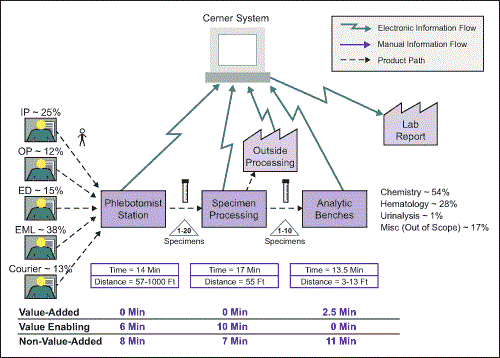
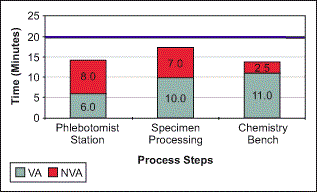
The project team started by going to the “gemba” or “place of work” to find out what really went on from the view of a lab sample. This was done by following a lab sample through the normal, uninterrupted process in the lab. This was done for a few “stat” and “floor” labs. The observations were then used to create a value stream map, spaghetti map, time-value analysis and a Takt time analysis of the lab turnaround process.
Introduction to Lean Concepts
The hospital’s lab team then convened for a couple of lively didactic learning sessions to understand the basics of Lean. Consultants first discussed the concepts of value-added steps and non-value-added steps and the team members offered up many examples of waste in their labs. As the team worked through some more advanced Lean concepts, it started to get a picture of the power of Lean. Team members then participated in an interactive exercise to pilot these Lean concepts in a mock mini-Kaizen event. There were many “ah-ha” moments in the exercise as the team learned to break apart processes and reduce waste. At this point, team members unanimously agreed that Lean was something they could use to make positive changes in the lab. Now it was time to really see what was going on in the lab using the Lean tools.
Examining the Current-State Maps
Armed with a new understanding of how Lean searches for and eliminates waste in processes, the team examined the current-state maps that had been created.
This exercise helped participants to correctly see the lab processes. For those members of the team who worked outside of the lab, this clarified the operations in the lab. More importantly, for those who worked in the lab (who would eventually own the process changes), this helped them to see the entirety of the lab processes. They were seeing the processes in an objective way that was outside of their own particular role. The entire team acquired a common language and decision criteria to move forward to make positive changes in the lab using Lean.
Conducting the Mini-Kaizen Event
Eight team members – technicians, managers, phlebotomists and secretarial staff – participated in the mini-Kaizen event. In addition, two consultants provided Lean and facilitation expertise. The director of labs and the chief pathologist acted as co-sponsors.
Day 1: The team started by doing a reality check and clarifying the goal statement for the mini-Kaizen. This identified that the two most important goals for the session were to “work on reducing stat turnaround time (TAT)” and to “eliminate waste in the phlebotomist and specimen processing areas.” The team agreed that its actions would be directed by this goal statement but not limited by it. Any positive changes the team could accomplish in the labs would not be off limits.
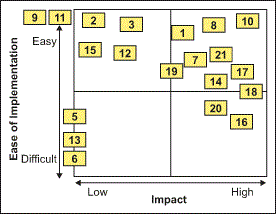
To get a jump-start on try-storming, team members brainstormed and prioritized 21 unique ideas that were categorized into three groups – “just do it,” “try-storm” and “hold for later.” The ideas are listed below. Figure 3 shows how they were ranked and evaluated.
List of Ideas:
1. Order placed in ER at time of draw
2. Install specimen label printer in ED
3. ED physician education around CPG’s
4. Phleb. place order on verbal ok (no verbal orders allowed)
5. Second shift lab tech in ER
6. ED collect all labs (nurse draws)
7. Classification in ED of who is actually doing draw of patient
8. Lab person carry stat beeper 24/7 instead of calling labs
9. Tube system
10. ER labs runner
11. Stat lab
12. Designated area in lab for stats (prototype for stat lab)
13. Centrifuge in ER
14. Spin any labs holding for orders
15. Full-time designated person in specimen processing area
16. Separate clincial and anatomical specimen processing
17. Have a visual sign “stats spinning”
18. Put alarm on last centrifuge
19. Reorganize secretary and phlebotomist area
20. Do not batch labs to spin
21. ED follow EML
The team had four ideas related to stat labs from the emergency department (ED) that were relatively easy to implement and that it wanted to attack first. The team implemented these ideas. A key learning took place at this point…the importance of communication. Although steps had been taken to communicate potential changes in the Kaizen, the ED team members were somewhat reluctant to adopt the changes and half-heartedly accepted. The team learned a lesson and moved on.
Because the other ideas, related to changes in the phlebotomist and specimen processing areas, were more complicated (and temporarily disruptive), the team spent the rest of the day coming up with detailed plans about how it would try-storm the ideas the next day, including what supplies would be needed and how they would communicate.
Day 2: The team went to work try-storming its ideas for the phlebotomist and specimen processing areas, which included implementing some visual controls and a physical swap of the phlebotomist and secretarial work areas in the lab. That idea would clear up the main traffic bottleneck in the lab and reduce distance traveled. Based on the lesson learned about the importance of communication, the team brought in the management team to oversee moving the area since it created a lot of temporary turmoil.
The team spent some time determining its follow-up plan for the ED fixes, which it realized would take a more planned-out rollout and communication plan to leverage a buy-in from the ED management. For all the fixes that were done in the mini-Kaizen, the team discussed possible measurement (control) plans, communication plans and next-steps plans.
Kaizen Results: What Was Accomplished
The Kaizen team did an estimate of the expected benefits as outlined in the table below:
| Summary of Expected Benefits |
| Hard Benefits |
| Phlebotomist/Secretary Move |
| Phlep./tech walk distance – 4,000 feet saved per day |
| Phleb./tech motion – Reduce TAT 1 minute per sample |
| ED Communciations Changes |
| Centrifuge stat visual control – Reduce TAT 5 minutes per ED sample |
| ED runner – Reduce TAT 1 minute per ED sample |
| ED add-on fax – Reduce TAT 1 minute per ED sample |
| Clarify who draws test – Reduce TAT 5 seconds per ED sample |
| Soft Benefits |
| Standardized some processes |
| Addressed some compliance/regulatory issues |
The 4,000 feet of walking distance saved led to an actual reduction of more than 265 miles of lab staff walking per year.
After time and data collection, statistical testing proved a three-minute reduction in median stat lab turnaround time, from 45 minutes to 42 minutes (across all three shifts). Statistical testing also showed statistically significant reductions in the median defect number (TAT greater than 60 minutes) for the a.m., the p.m. and the midnight shifts.
Conclusion: Lean Makes an Impact in the Lab
The Ephrata project team was able in a relatively short period of time (eight days) to examine its labs, learn some basic Lean concepts and, most importantly, make a dramatic impact on the waste which amounted to hundreds of miles of walking eliminated each year and statistically significant drops in stat lab turnaround time. The energetic team environment created by the hospital’s project team learning some new Lean tools set the stage for a successful Lean event by all measures.
Since the mini-Kaizen event, the team continues to make improvements. This project demonstrates how Lean can be used immediately once there is an understanding of the current state and the basic toolset, but it is only the beginning of the Lean journey.